Volume Impression®
$169.00
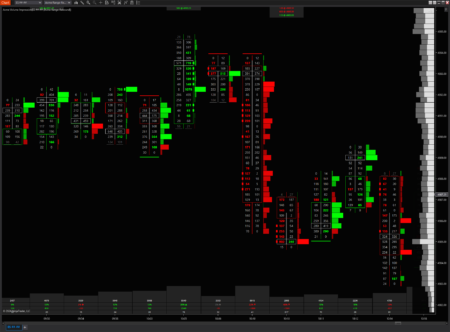
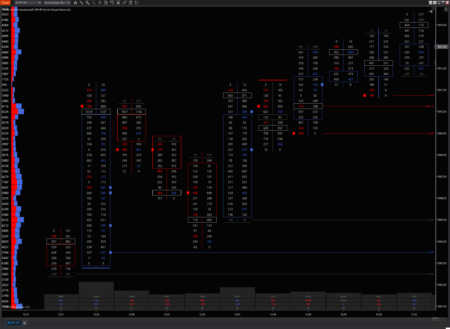
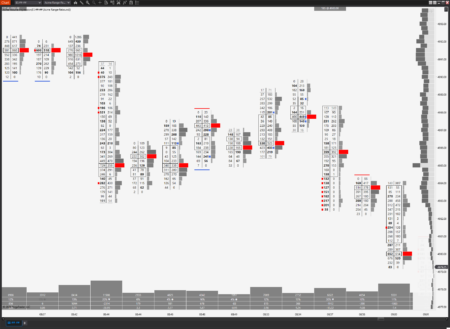
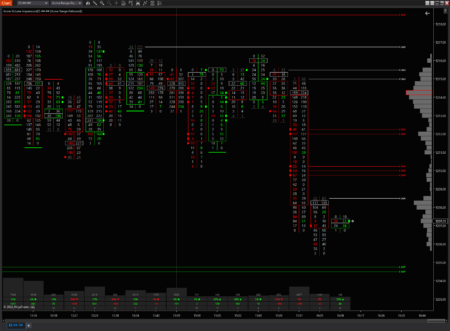
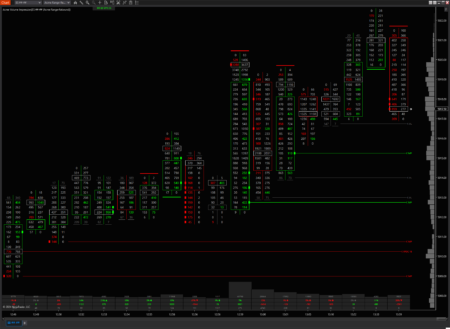
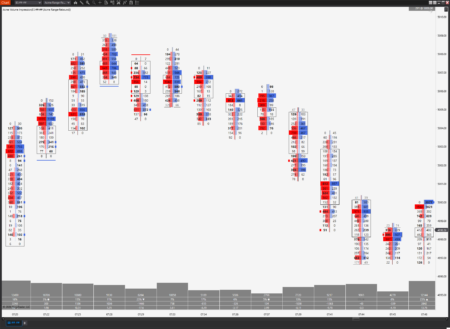
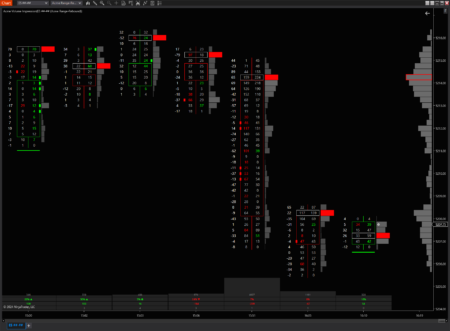
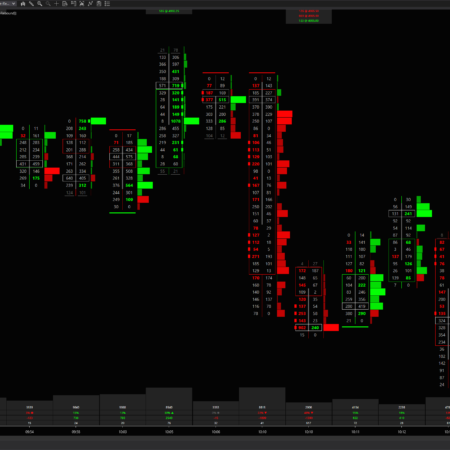
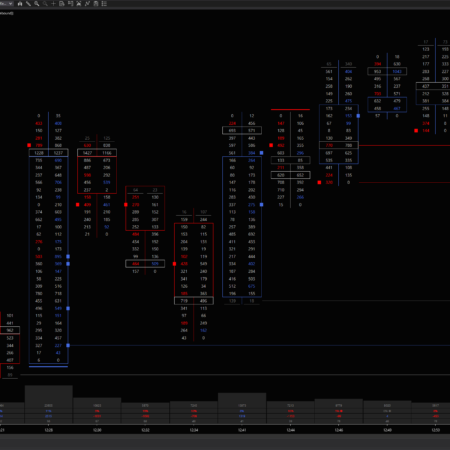
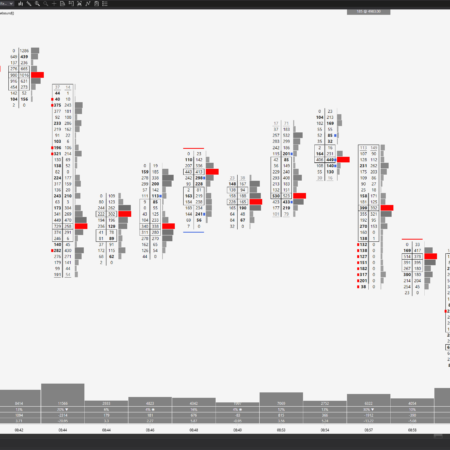
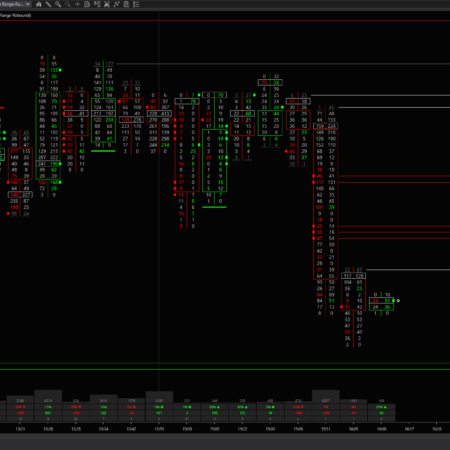
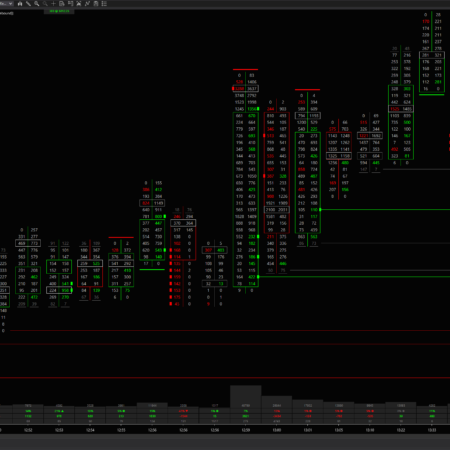
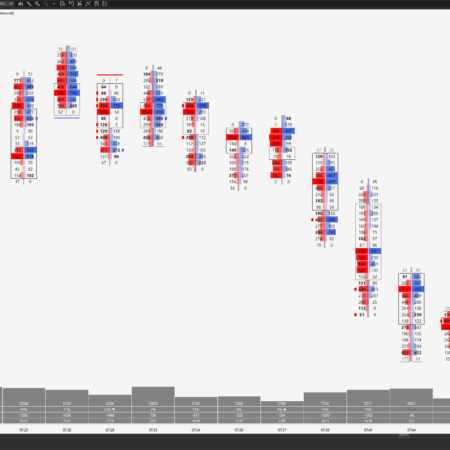
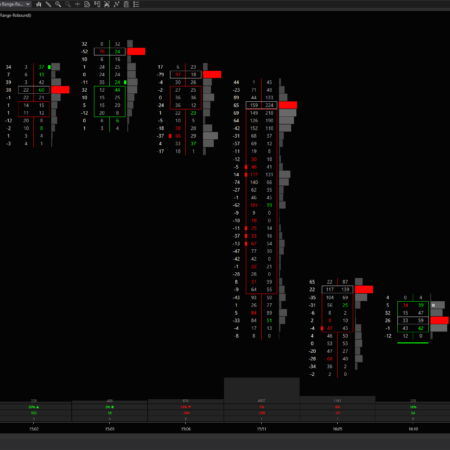
Where candle patterns can be ambiguous and misleading, the Acme Volume Impression® is devoted to one all-important task: to make buying and selling pressure imbalances and critical patterns in the volume-at-price data obvious and precise. Focusing on conceptual clarity and visual simplicity, the 100% redesigned Volume Impression sets a new standard for volume analysis charts.
Includes indicator and how-to guide for installation & configuration.
- Description
- Additional information
Description
- Choose between bid/ask and up/downtick and the new hybrid evaluation strategies depending on your instrument and data provider’s data availability. Even if your data provider does not supply historical bid and ask data, the hybrid evaluation strategy can provide a seamless chart experience.
- Supports both traditional horizontal price comparison as well as the newer diagonal imbalance buy/sell comparison.
- Features a new multi-style volume sidebar which can show both volume at price as well as buying and selling imbalances, and can be attached to either side of the chart.
- Bars can be shown as candles, with an open/close range bar or simply as columns of numbers.
- Delta-at-price can optionally be shown in addition to buy and sell volume
- Sports the following types of volume pattern highlighting:
- Bold imbalances
- Buying and selling exhaustion (with audio alerts)
- Incomplete bar auctions
- Absorption + buying and selling aggression (with audio alerts)
- Impulsive buy and sell side activity
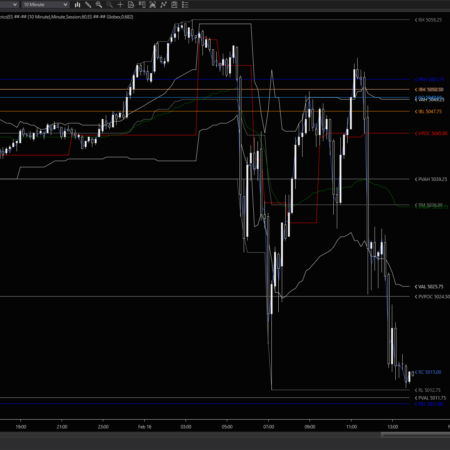
- VPOCs & naked VPOCs
- Naked impulse/imbalance prices
- Naked incomplete auctions
- Configurable value areas/volume clusters
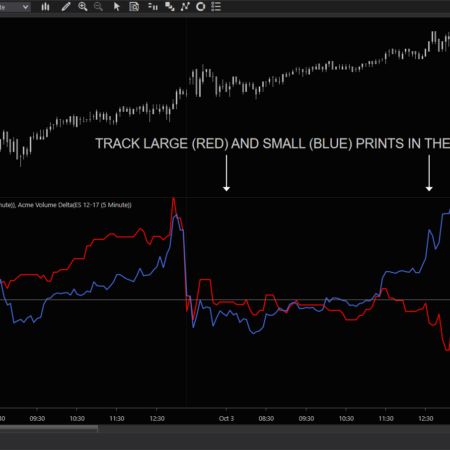
- Large/block trades (with audio alerts)
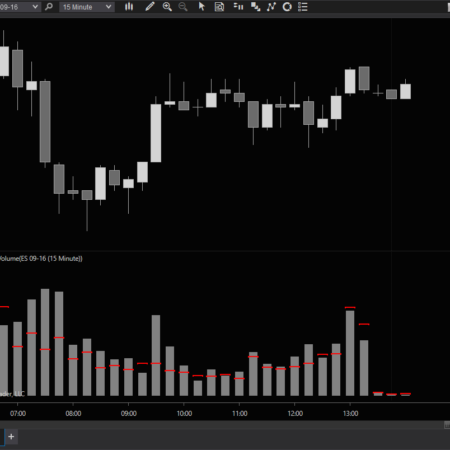
- Bar total volume
- Bar delta volume
- Pace of trade
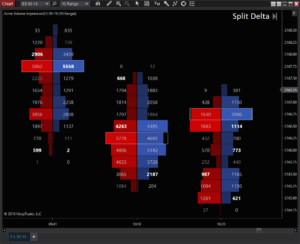
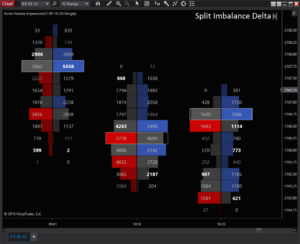
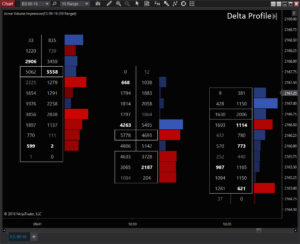
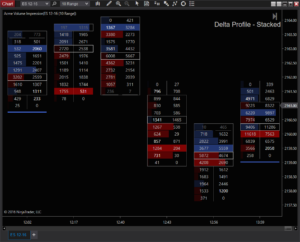
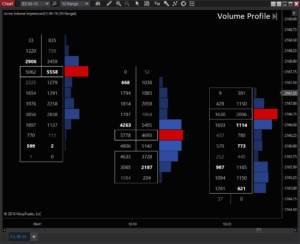
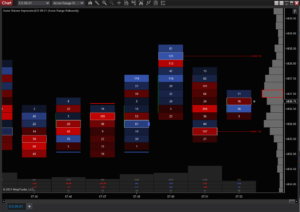
- Has 4 built-in per bar profile styles with multiple variations:
*Note that profiles styles shown above are intentionally high-contrast for illustration purposes. All colors and styles are trader-configurable. Though the term is commonly used to describe any chart of this variety, Footprint ® is a registered trademark of MarketDelta LLC. The use of that trademark on this site appears in an editorial context and no infringement of copyright or trademark is intended.
Additional information
| Supported Markets | Futures, Stocks & ETFs, Forex |
|---|---|
| Time Frame | Intraday, Day |

