Zig Zag
$89.00
- Description
- Additional information
Description
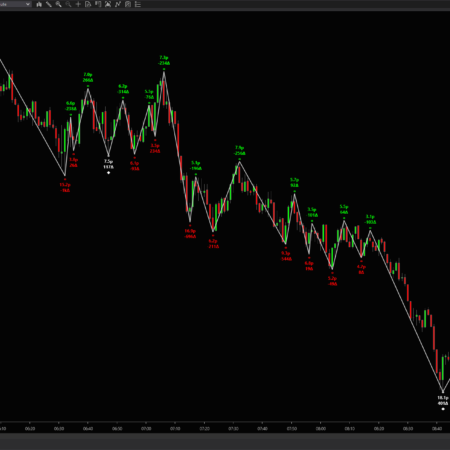
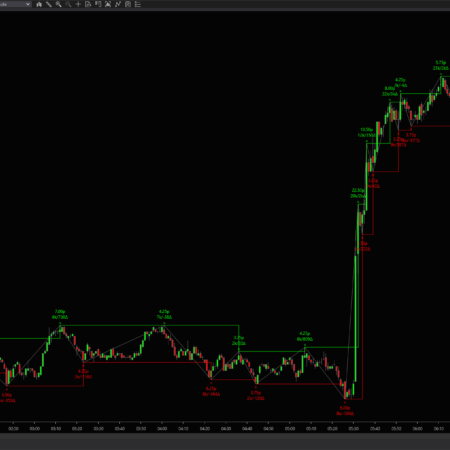
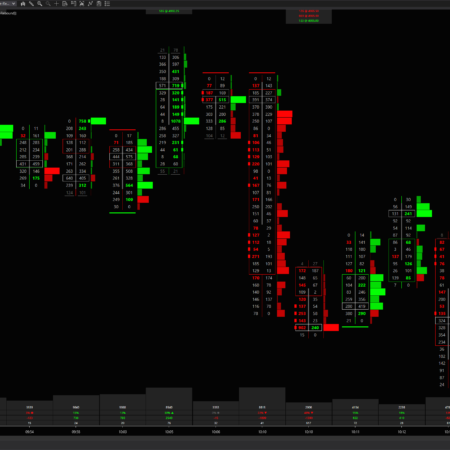
Swings, rotations, zigs and zags. A move by any other name is still the same, and the Acme Zig Zag helps you visualize the market swings as they unfold.
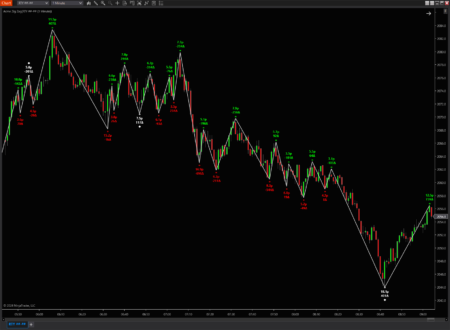
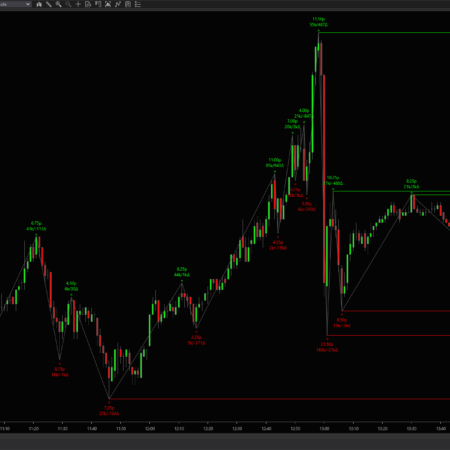
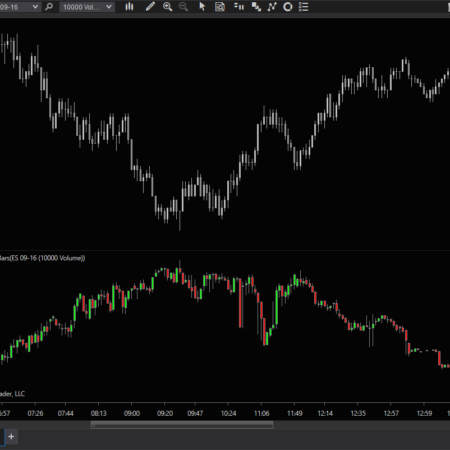
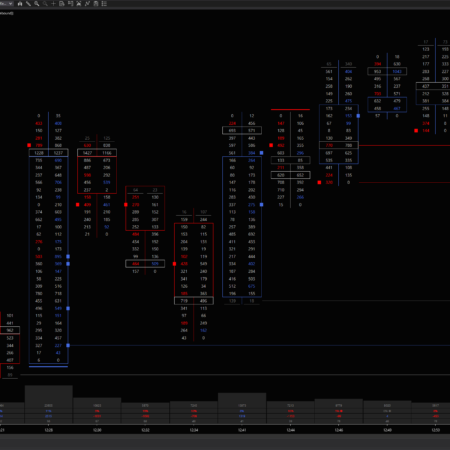
- Displays up to 4 critical metrics of each swing – points, time, volume and volume delta. Any combination of the metrics can be displayed.
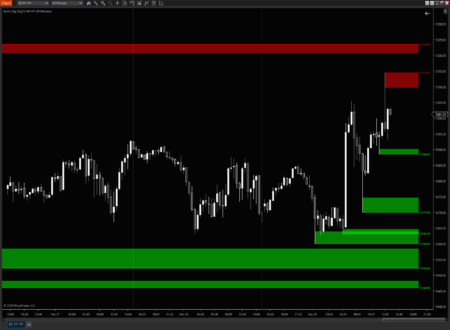
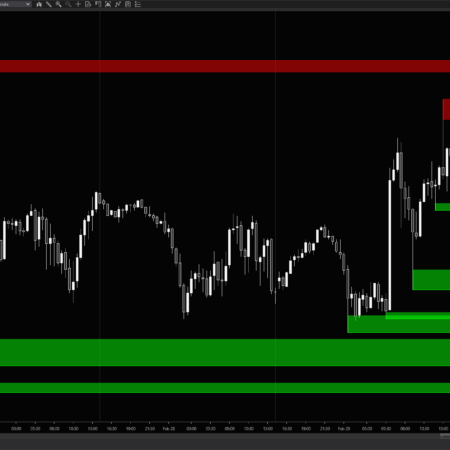
- Displays current and/or naked swing highs and lows, and can automatically highlight supply and demand zones
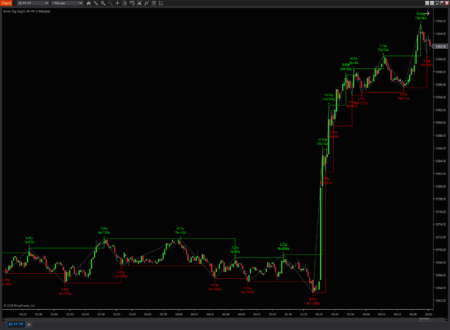
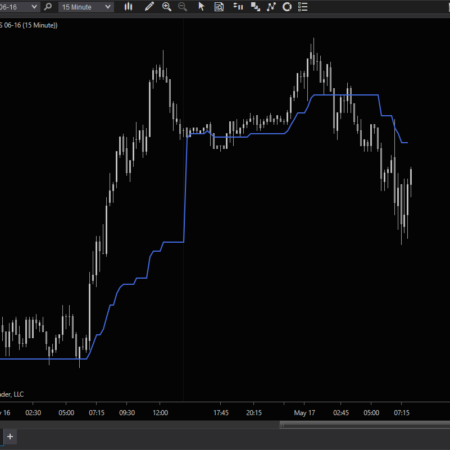
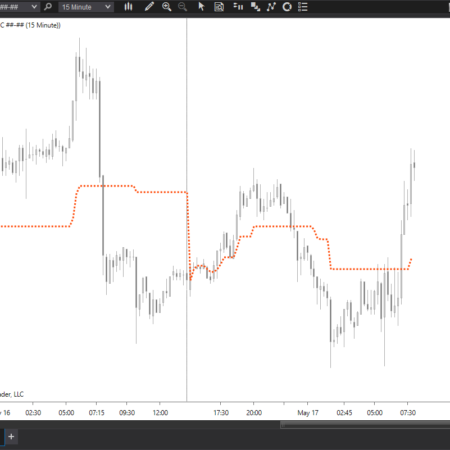
- Displays a swing channel – very useful for observing range breaks and reversions
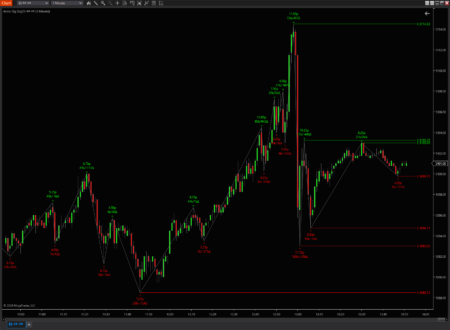
- Developing (not yet completed) swing can be optionally displayed
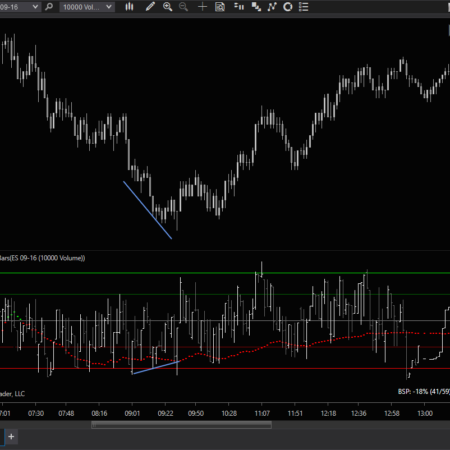
- Automatically marks a swing divergence pattern using the volume delta metric when consecutive swing highs or lows have a declining or rising delta
- Swings can be determined by either point or percentage of movement
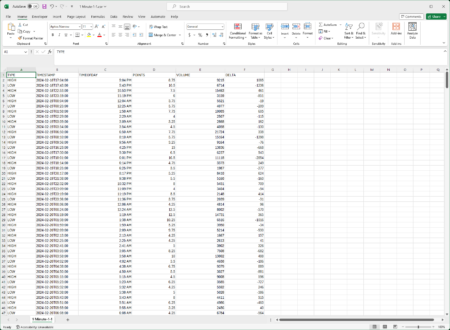
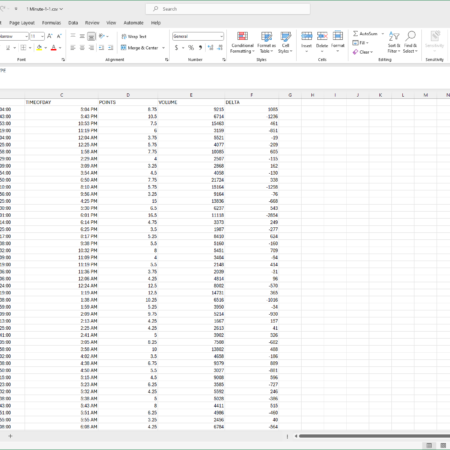
- Swing data can be exported for deeper study in the data analysis tool of your choice such as Microsoft Excel® or Google Spreadsheets (see quote above!)
Why export your data? Because you want to know how your instruments tend to move, statistically, so you can make solid trading choices. Here’s a story problem not unlike ones you probably had in grammar school:
If you know your instrument tends to swing 10 ticks on average and 20 ticks at the 2nd standard deviation extreme, and you’ve already seen a 20 tick move, what’s the probability of further move in the same direction? Ding ding! That’s right, about 5% or less… start looking for a reversal!
Additional information
| Supported Markets | Cryptos, ETFs, Futures, Stocks |
|---|---|
| Time Frame | Intraday, Day |

