Ok, I admit it. The title’s a riff on a lyric from the old Dire Straits song Money for Nothing. You’ve probably heard it, or maybe you wish you hadn’t. Either way, it’s relevant because I often see traders talking about “the 12:00 turn”, or “the 9:00 turn” or a reversal that’s supposed to magically materialize at specific times of trading day. Of course, the implication here’s that if you only knew about it ahead of time you could place (or close) your trade and rake in the coin. You know… money for nothing, chicks for free.
So I decided to ask and answer the questions. Can you get money for nothing? Are chicks really free?
Methodology
For this study I took the last 90 days of 1 minute data from each of the instruments in below, used the Acme Zig Zag to export the swing data then graphed it in Excel. The only real variable in each of the instruments is the setting for the minimum swing size. I wanted to filter out the itty-bitty ones and still end up with sample size (aka “the N”) that could product statistically significant results. So I experimented a little with each instrument until I came up with a minimum swing that produced somewhere between 1000-2000 swings over that 90 day period. The specifics are in each section below.
All times are Pacific/UTC-8.
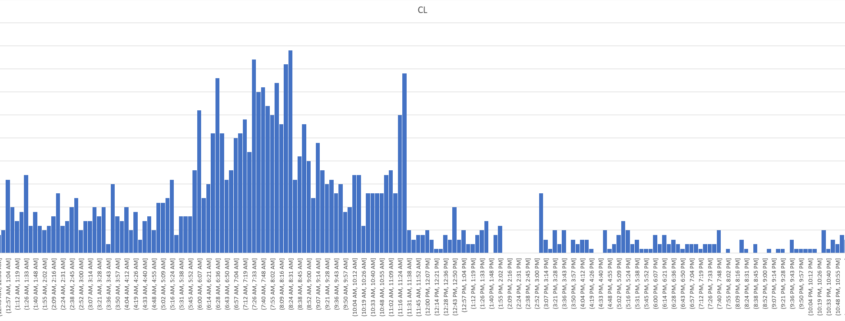
CL – West Texas Intermediate Crude Oil
- Minimum Swing Size: .2 point
- Sample Size: 1706
CL definitely has a tendency to reverse in the 8:00-8:20 window, as well as the 11:00-11:30 window. Some other notables are the long poles near the half hours between 6:00-7:30… the first 90 minutes of the session.
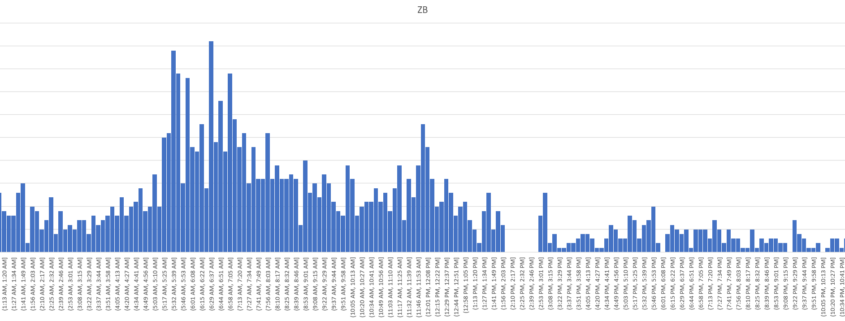
ZB – US Treasury Bond
- Minimum Swing Size: .1 point
- Sample Size: 1961
ZB has several common reversal times, the 5:30-5:40 window being the most prominent with other notables around 6:00, 7:00 and 11:45 – 12:00.
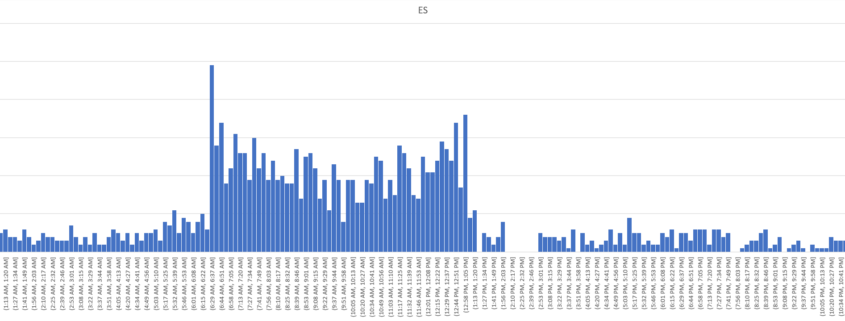
ES – S & P 500 Index
- Minimum Swing Size: 5 points
- Sample Size: 1762
Because the US equity indexes have the most significant cash-versus-futures session of all the instruments in this study it’s not really surprising that the most prominent reversal times are the open and close of the cash session. But it’s worth calling out the cluster of times from 9:00-9:15 AM as well as 11:15-11:40. There are some other long poles in there that tend to coincide with clock times,but honestly, they’re probably not frequent enough to call an edge. One thing I can say, though, is that ES operates on a rhythm not really apparent in the other instruments.
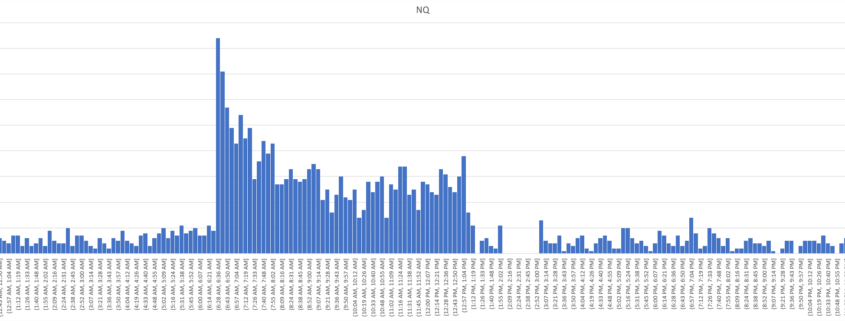
NQ – NASDAQ 100 Index
- Minimum Swing Size: 15 points
- Sample Size: 2501
NQ’s the rowdy kid. It starts the cash session kicking and screaming, then settles down considerably. As with ES, there’s a cluster of regularity around 9:00 and then another 11:15-11:30. This shouldn’t be too surprising – there’re a number of stocks in common with these two indices.
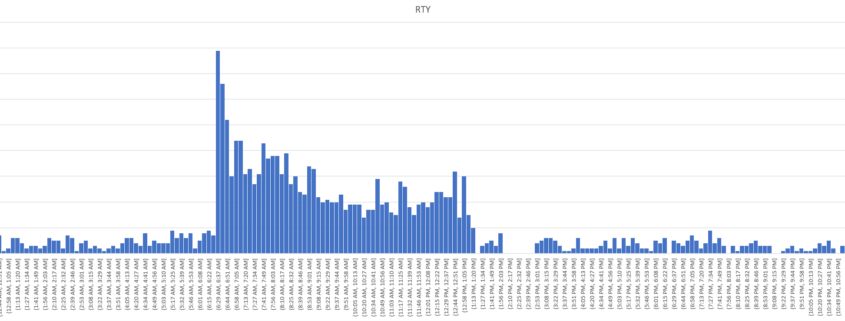
RTY – Russel 2000 Index
- Minimum Swing Size: 3 points
- Sample Size: 2057
Like NQ, RTY’s also a pretty violent out of the session gate. Many of the names in this index are not particularly liquid, so it’s not really a shock that this thing is basically a mosh pit that settles down after not too long. After the initial herks and jerks, the 6:50-7:05 and 7:30-8:15 windows yield a lot of swings, though I’d be hard pressed to say this is specific enough to trade with or against. Like the other stock indices, that 11:15-11:40 window has something to it. Buy and sell programs are tending to start up in this window once Wall Street gets back from their 3 Martini lunches.
Conclusion
Money for nothing? Chicks for free? Probably not, sadly. But is there enough regularity in these instruments that you should be paying attention and be ready to act during significant time windows? Absolutely.
Until the next time… trade ’em well.

