Adapt or die. It’s Darwin’s world – survival of the fittest. When you have to eat only what you kill, so to speak, you want to have the widest array of hunting and farming skills available, right?
Well, over the last couple of years I’ve refined my balance break trade techniques to bolster my P & L, especially in more volatile market conditions. So in this series of Crash Course installments I’m going to focus on market balances as a concept, structure and as a trading tactic. I first covered this topic a while back with the popular Powderkeg Trade post, but we’re going next-level deep in this series.
First things first, let’s define what a balance is:
- Balances are ranges of prices where buyers and sellers basically agree on price, based on available information.
- Balances are areas of liquidity. Liquidity is the availability of shares, contracts (or whatever) in a price range. It’s where the offers and bids are. No offers and no bids, no trades.
- Balances are very often areas of buried buying and selling excess or aggression.
That last point is crucial, and it’s the fundamental thesis for this type of trade. I want to catch over-eager long or short positions doing business within a balance area – because that’s where the liquidity is – flat footed when other participants inevitably move price out of the balance.
Next, let’s describe what a balance looks like:
- Balance areas are defined by a swing high and a low, usually inside a wider range, where price has swung at or inside that range at least twice and rotated back inside.
- Balances areas are visually symmetrical.
- Balance areas will have a volume or time profile that’s visually pretty normal. Normal isn’t a moral judgement, it’s a statistical term which describes naturally occurring distributions of data. You’ve seen it before – its the famous bell curve. I also cover this in the Volume and TPO Essentials piece.
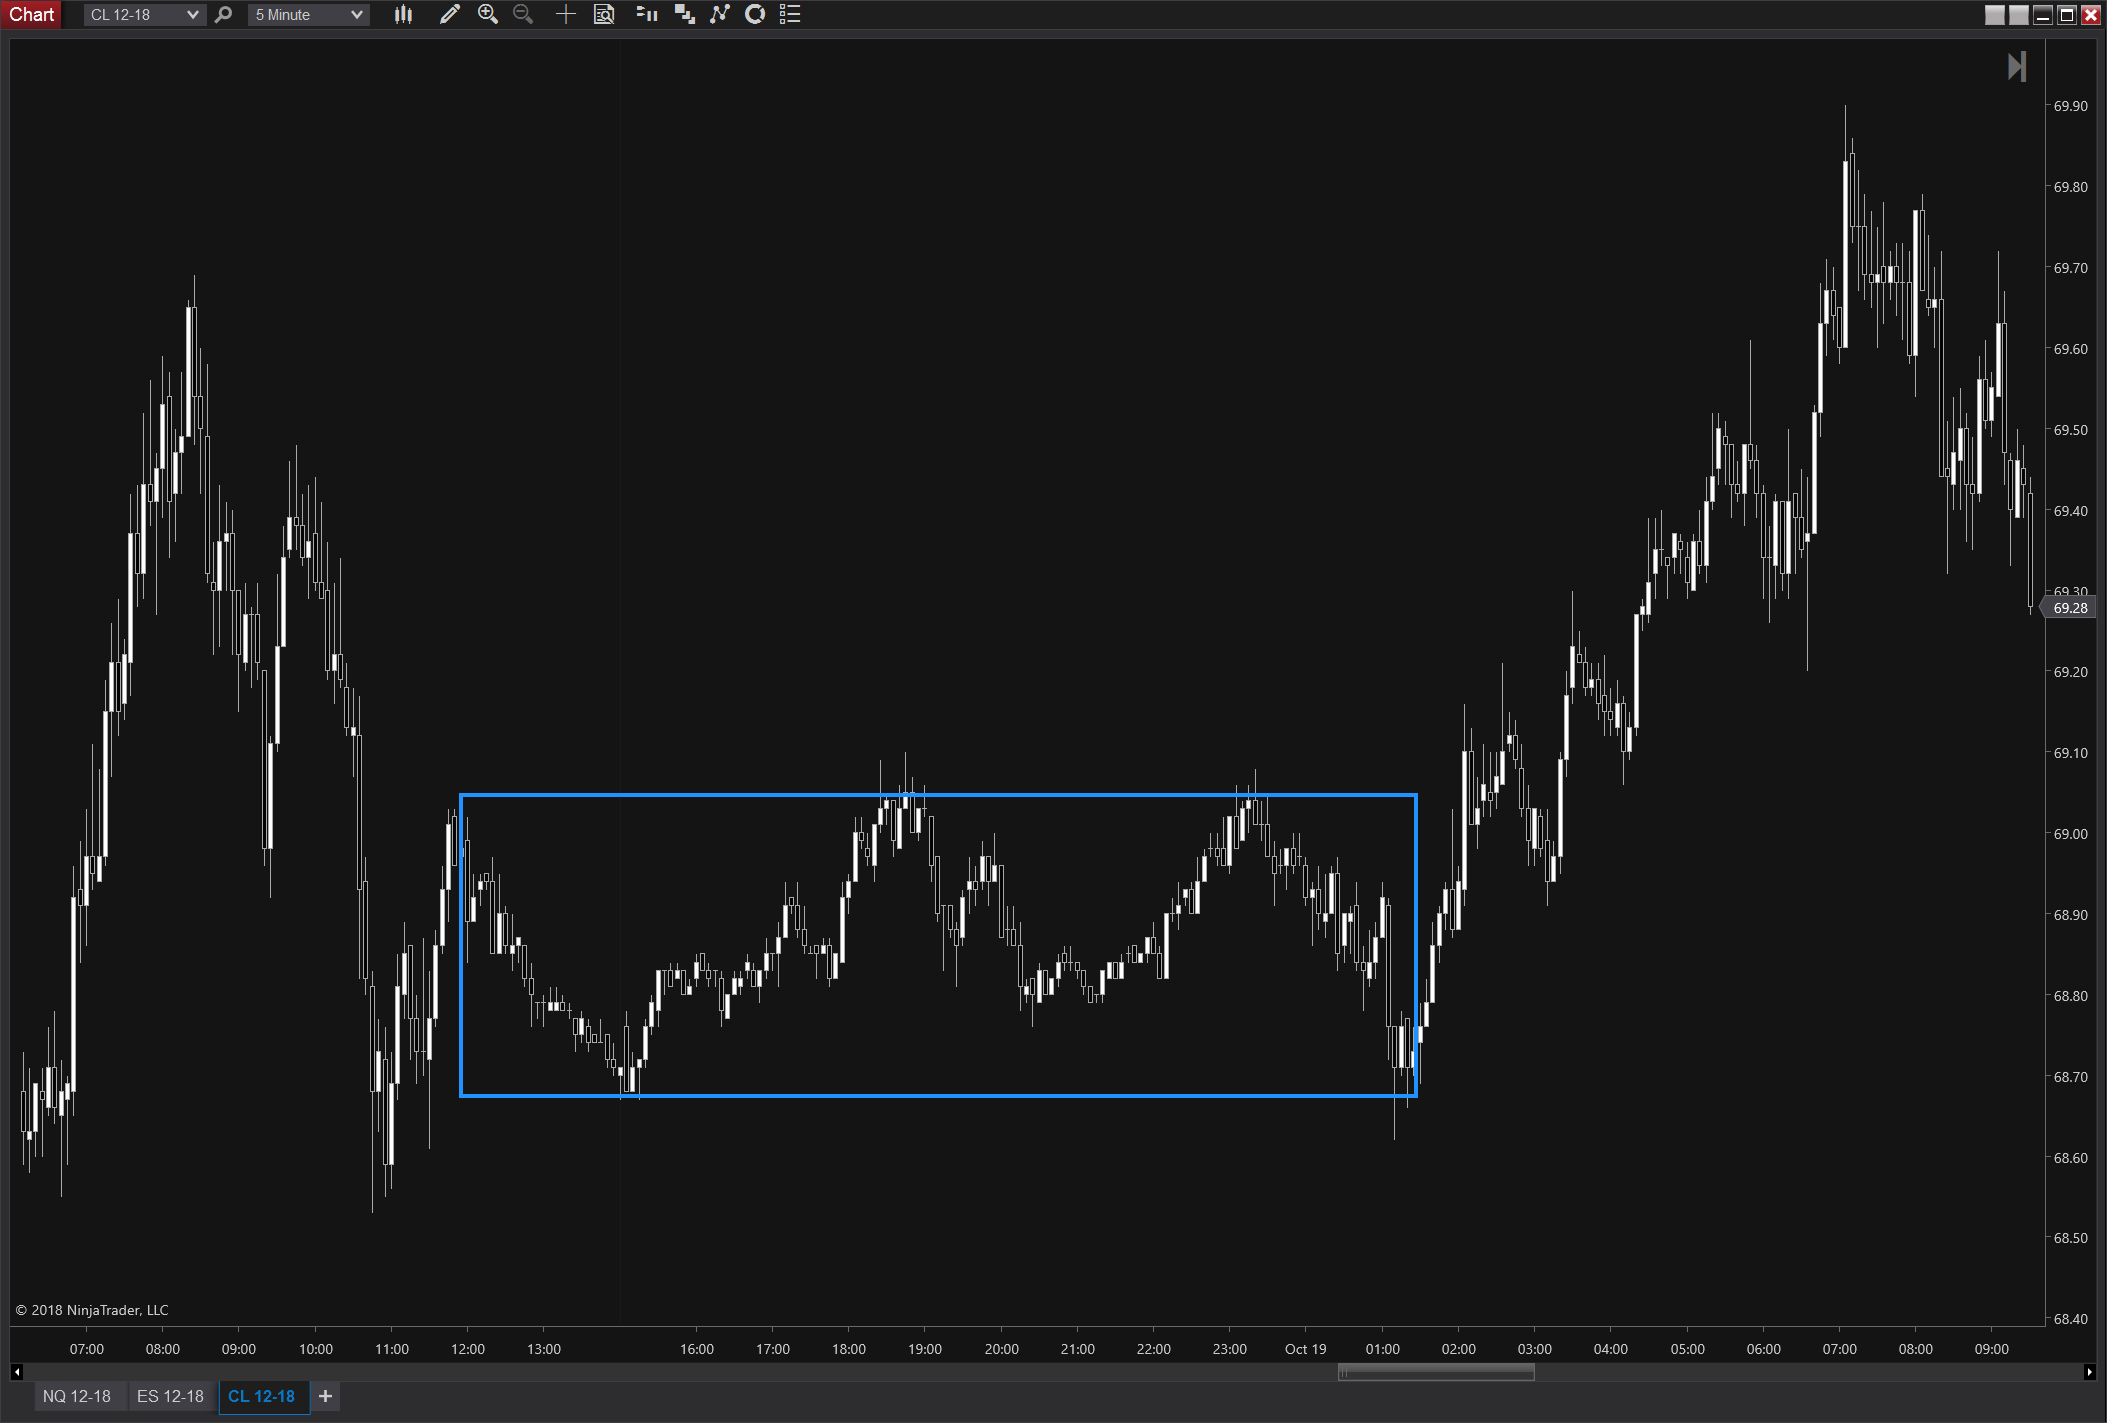
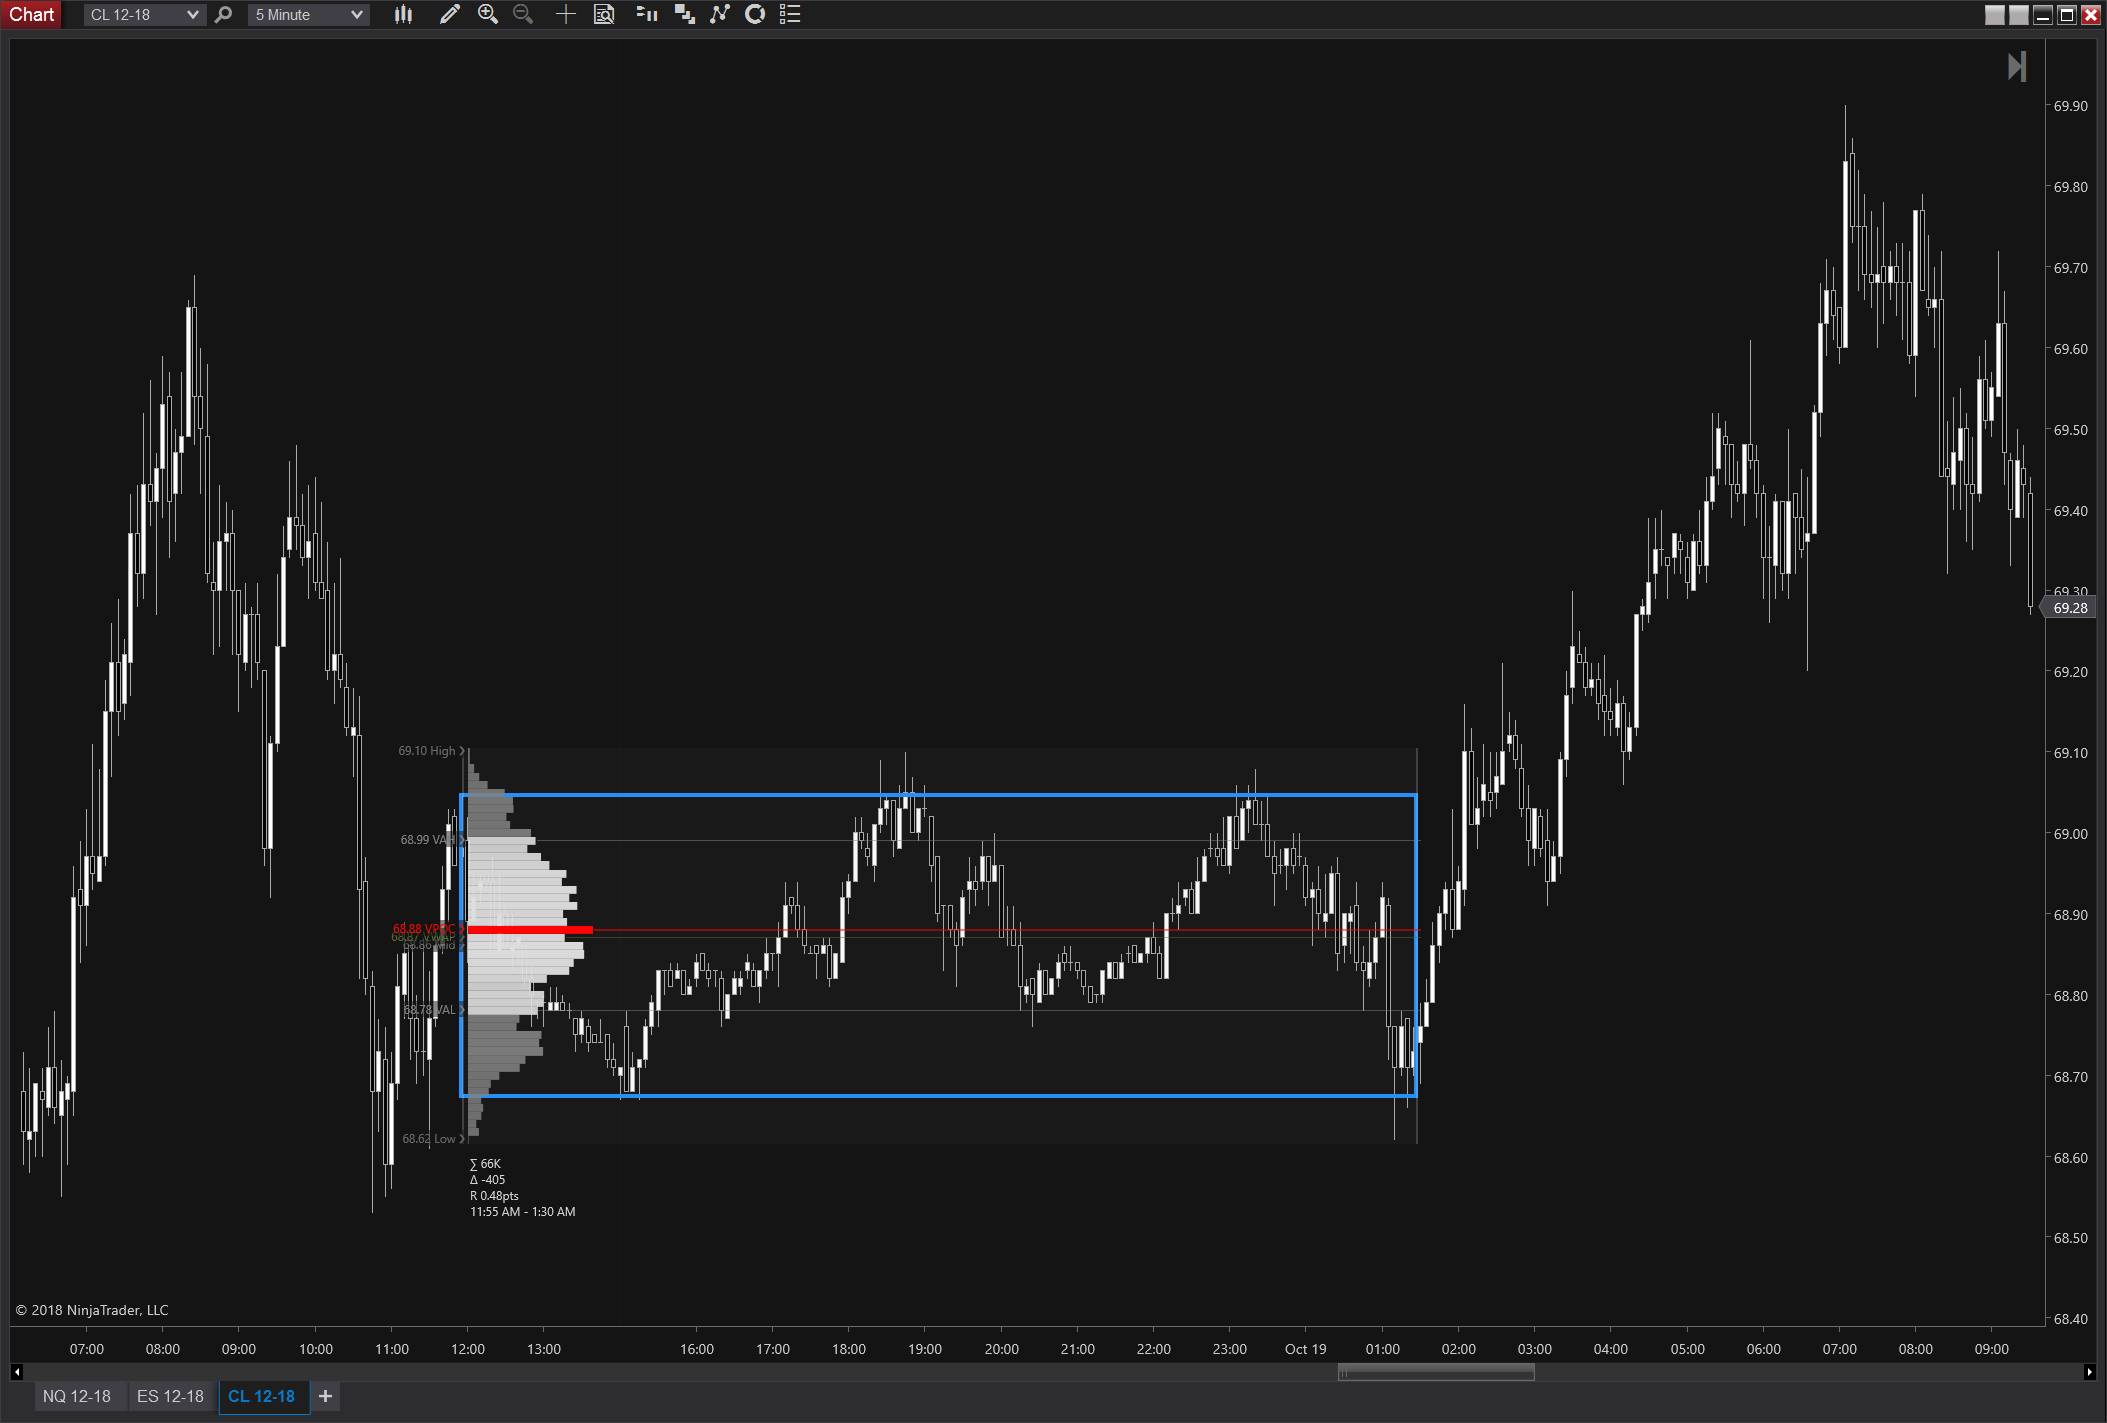
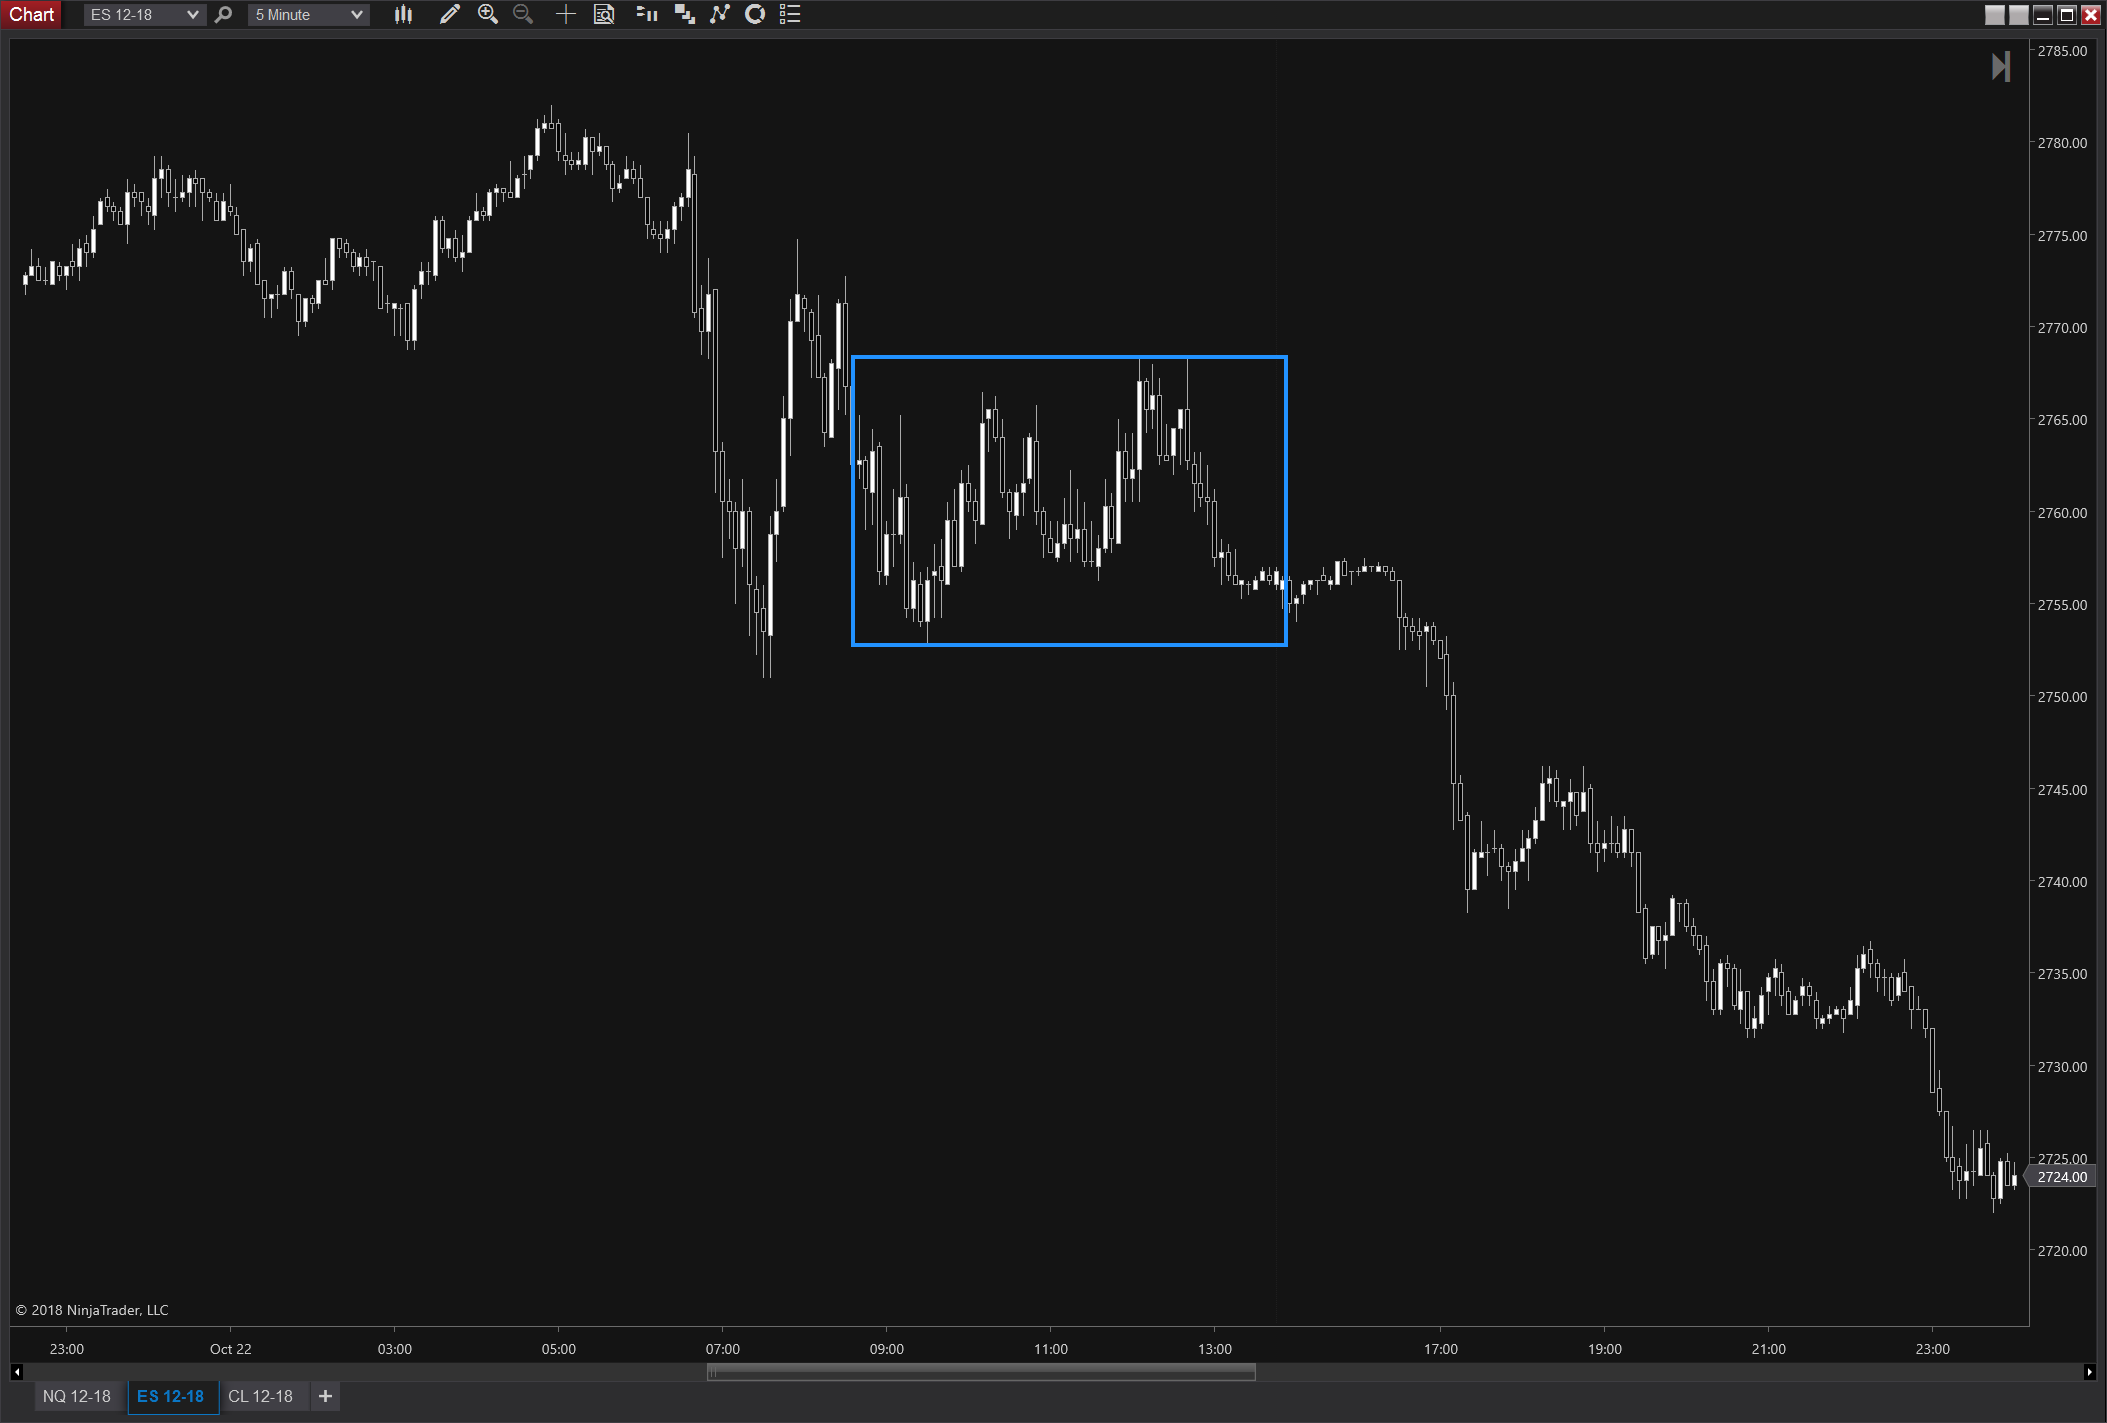
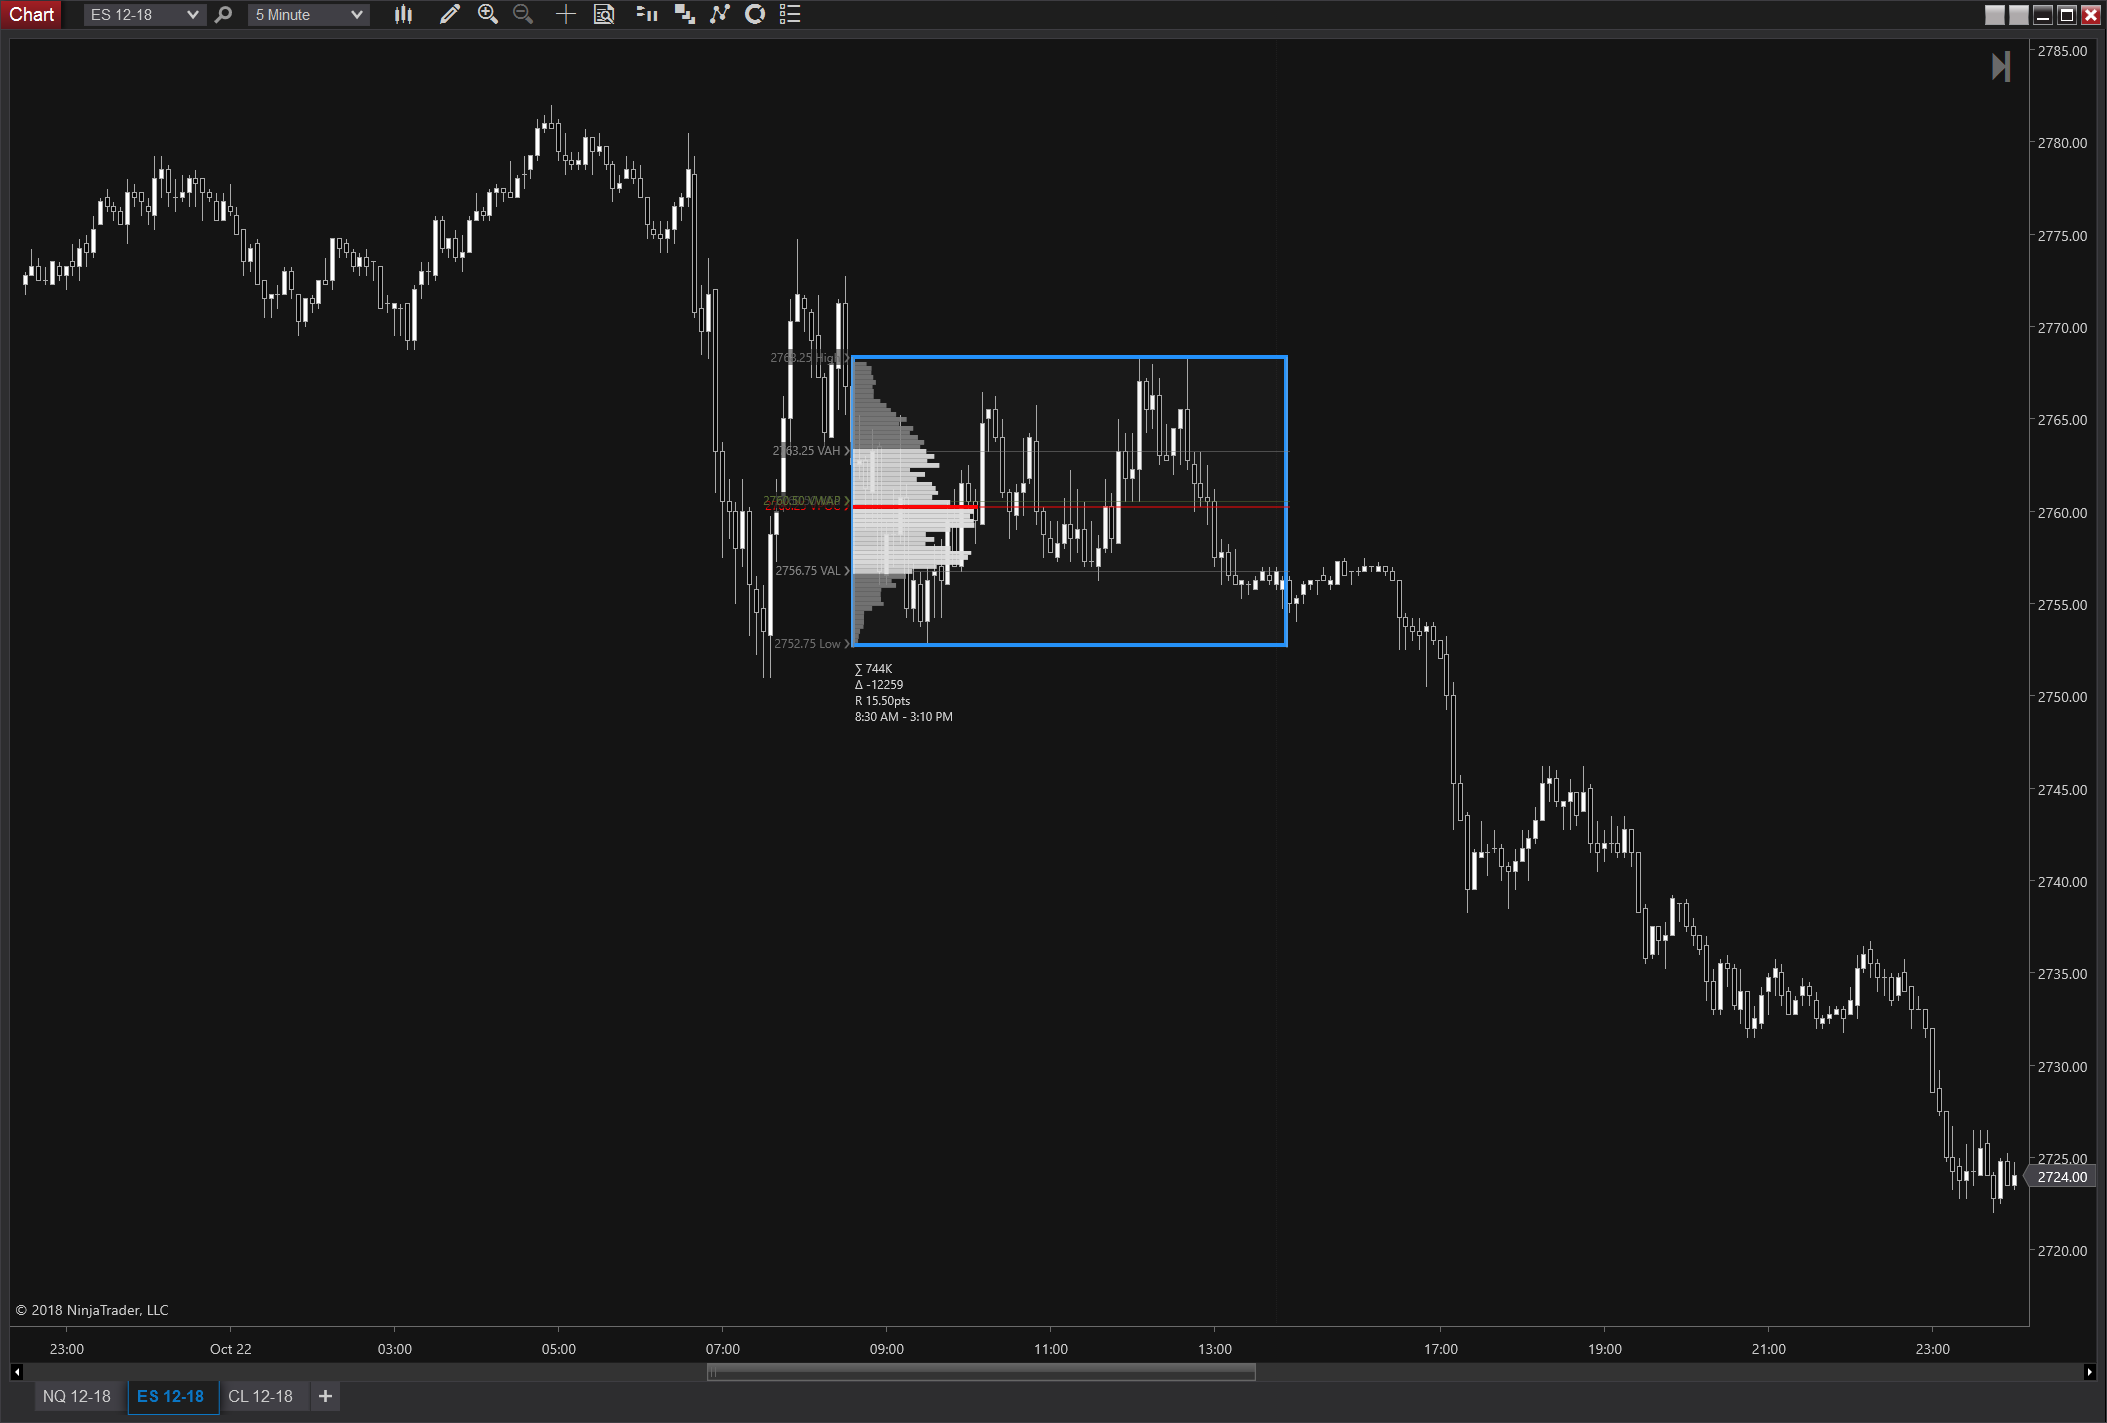
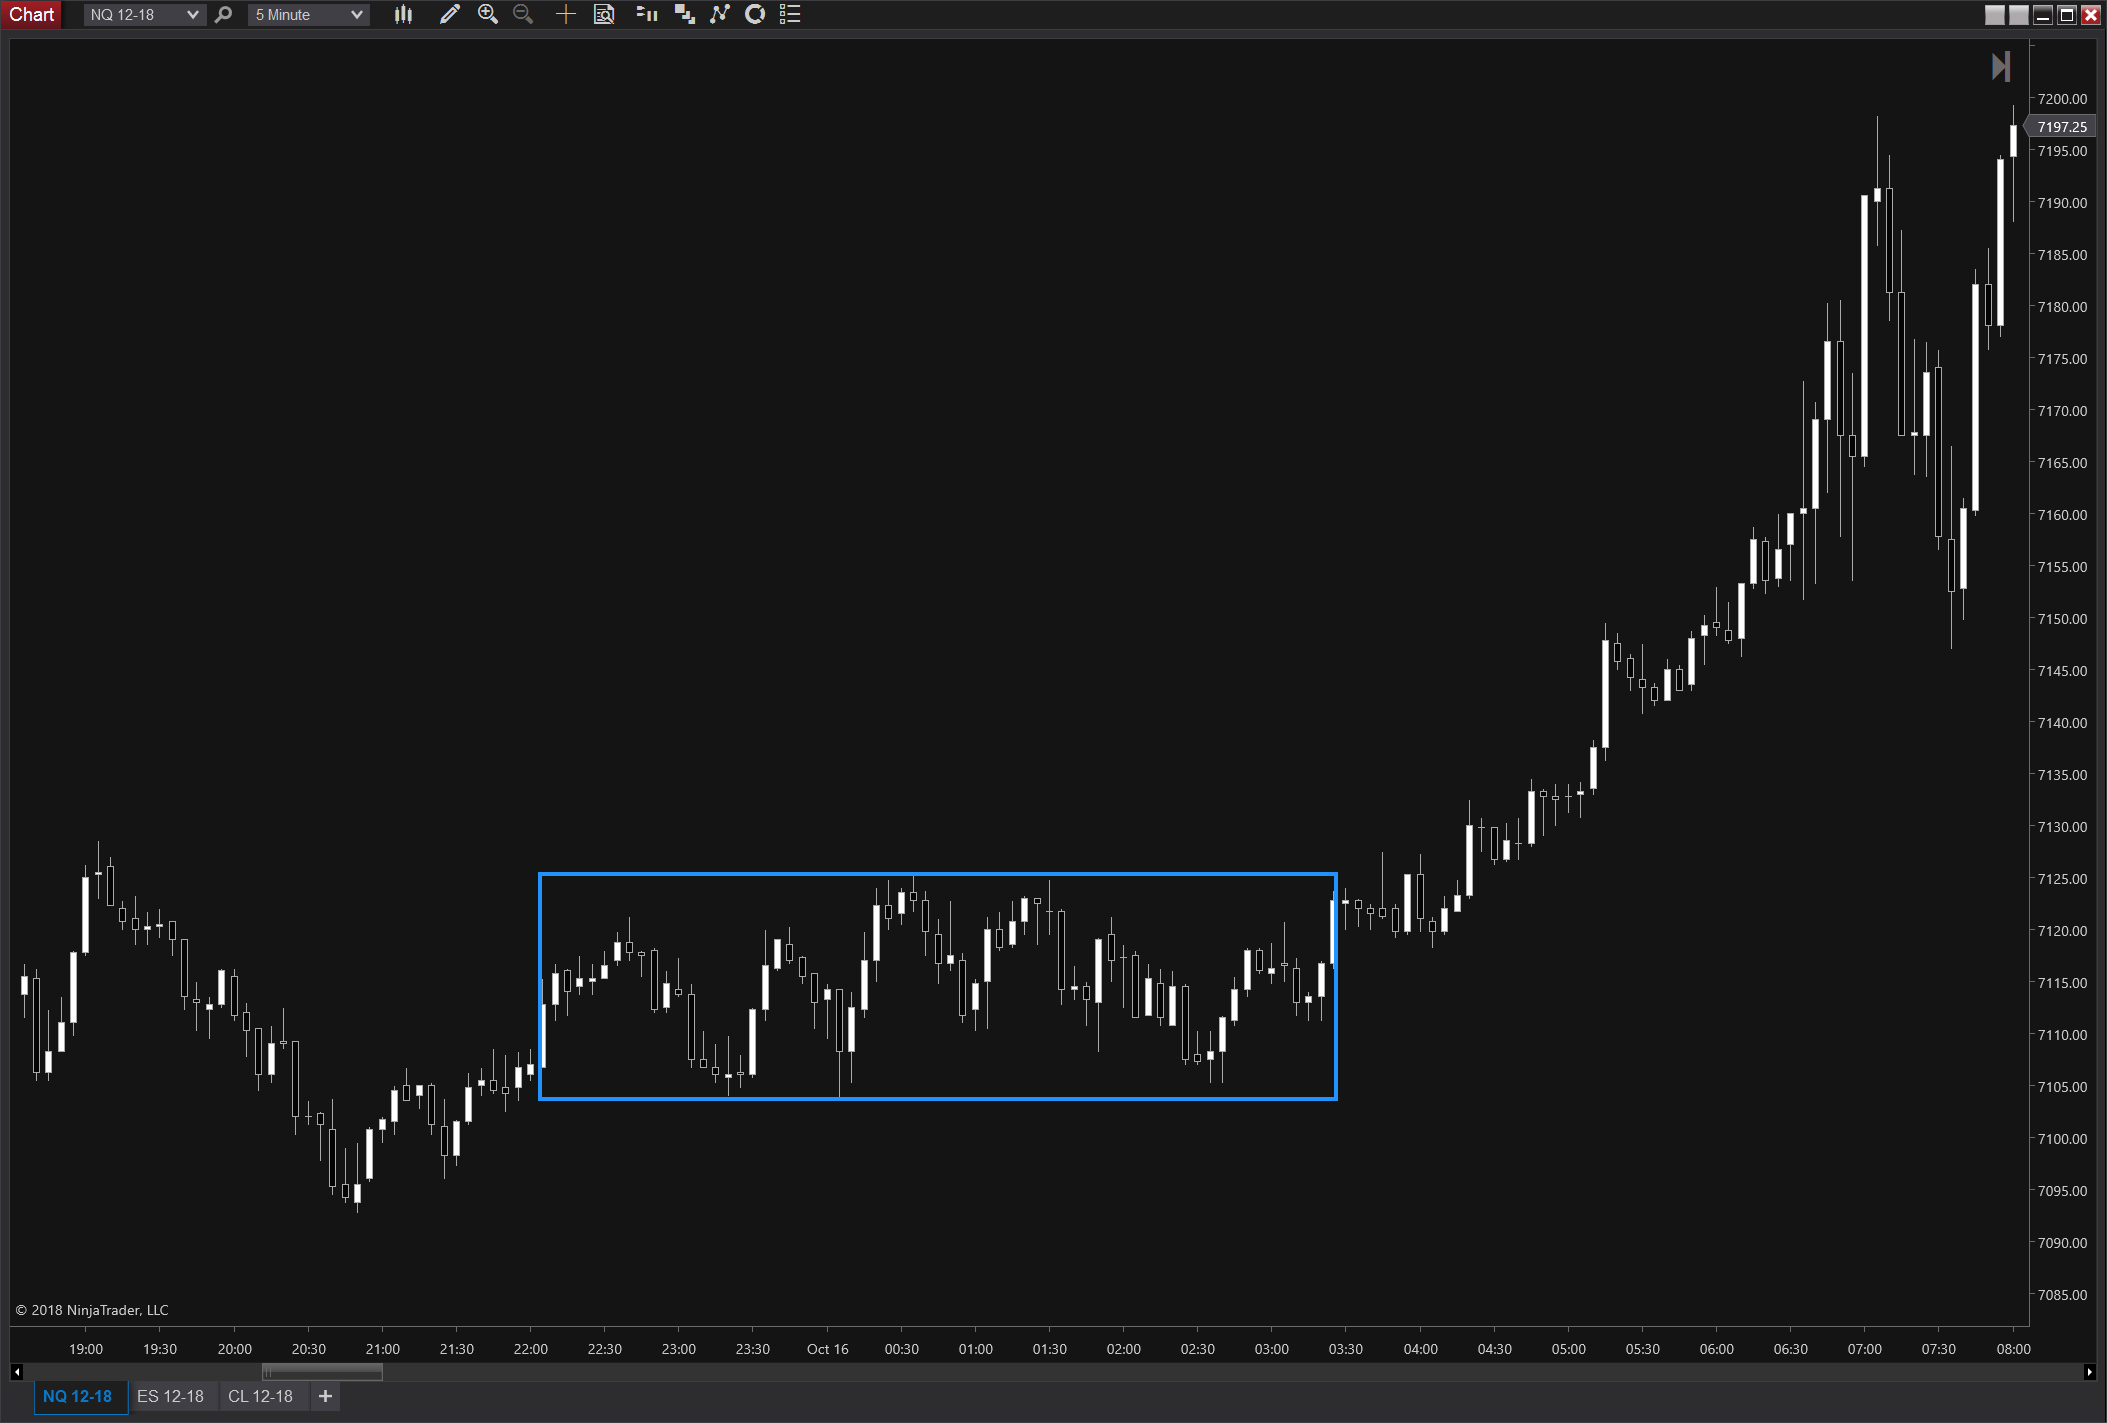
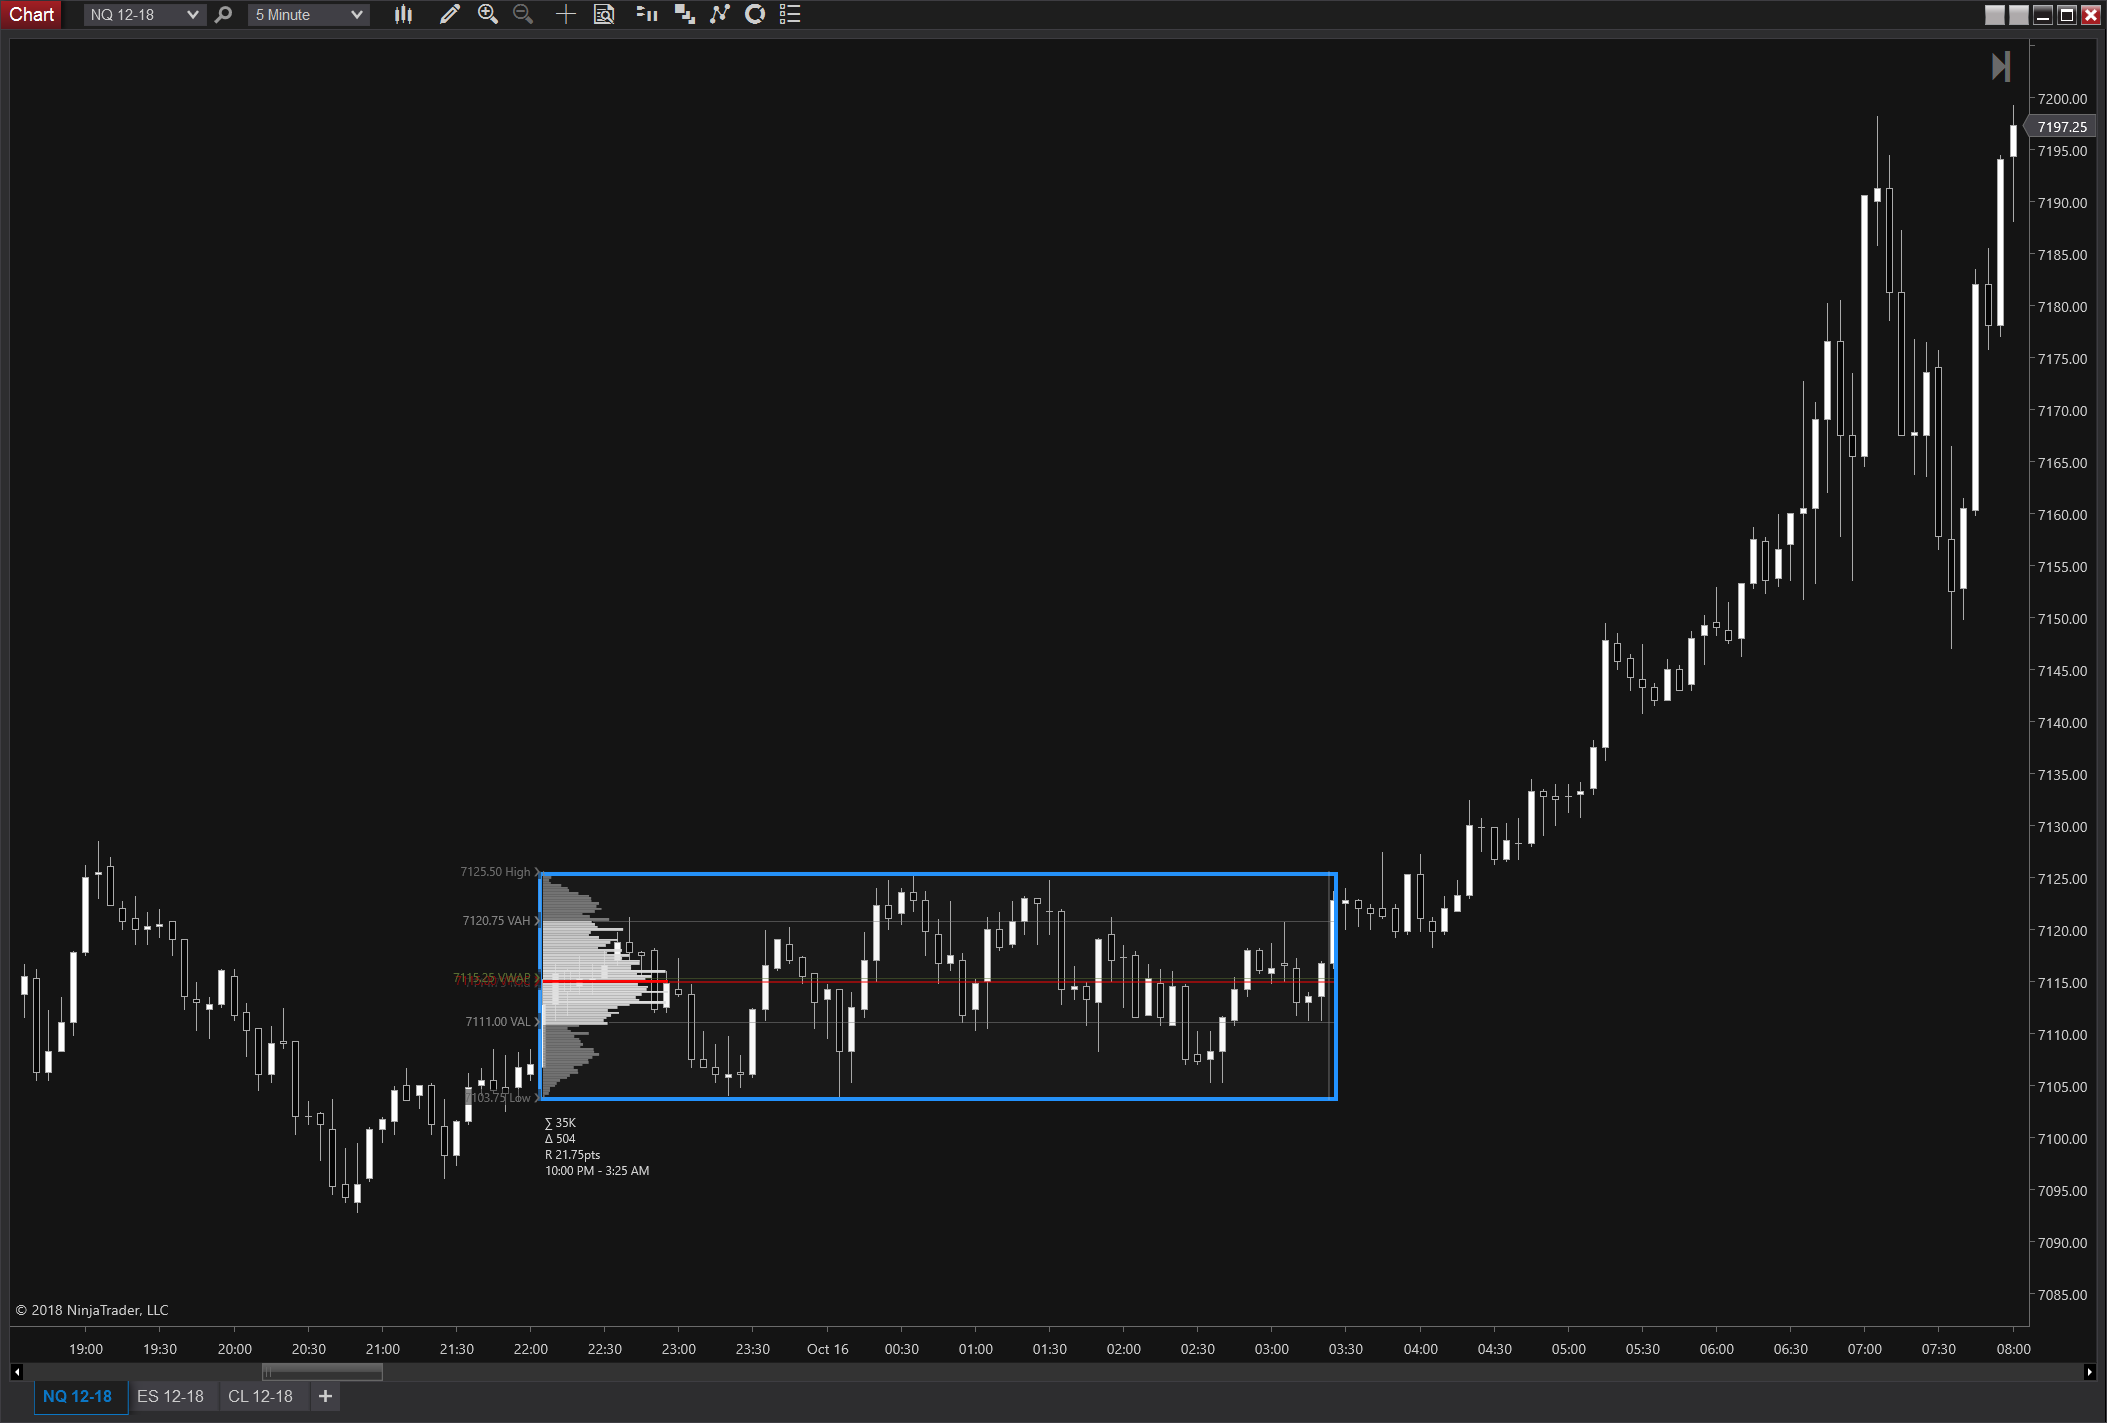
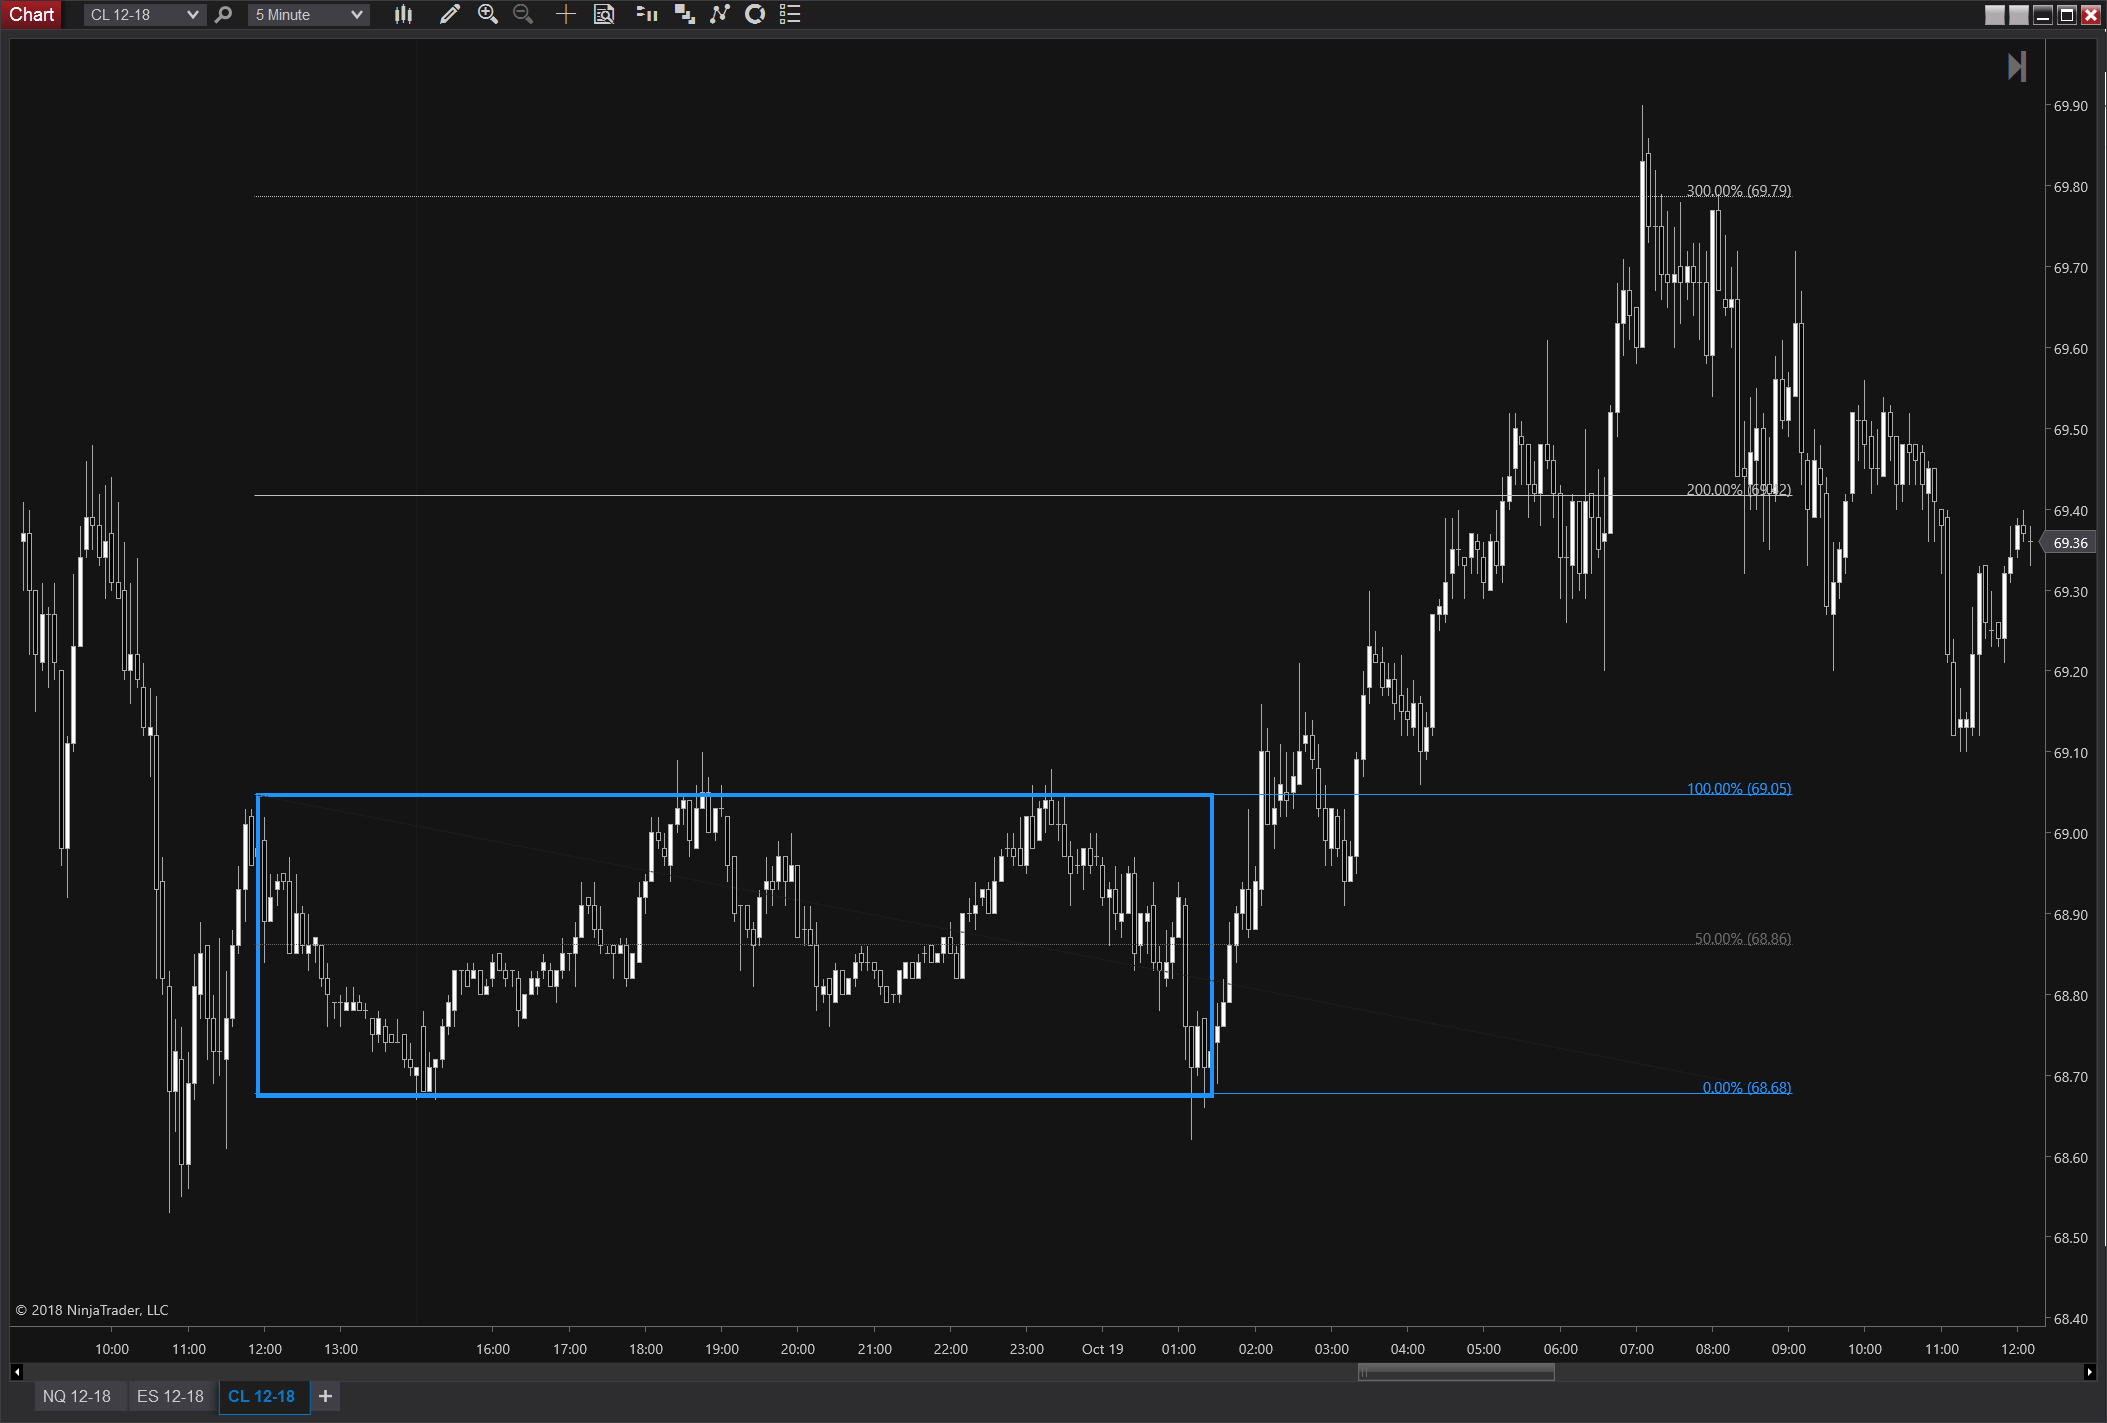
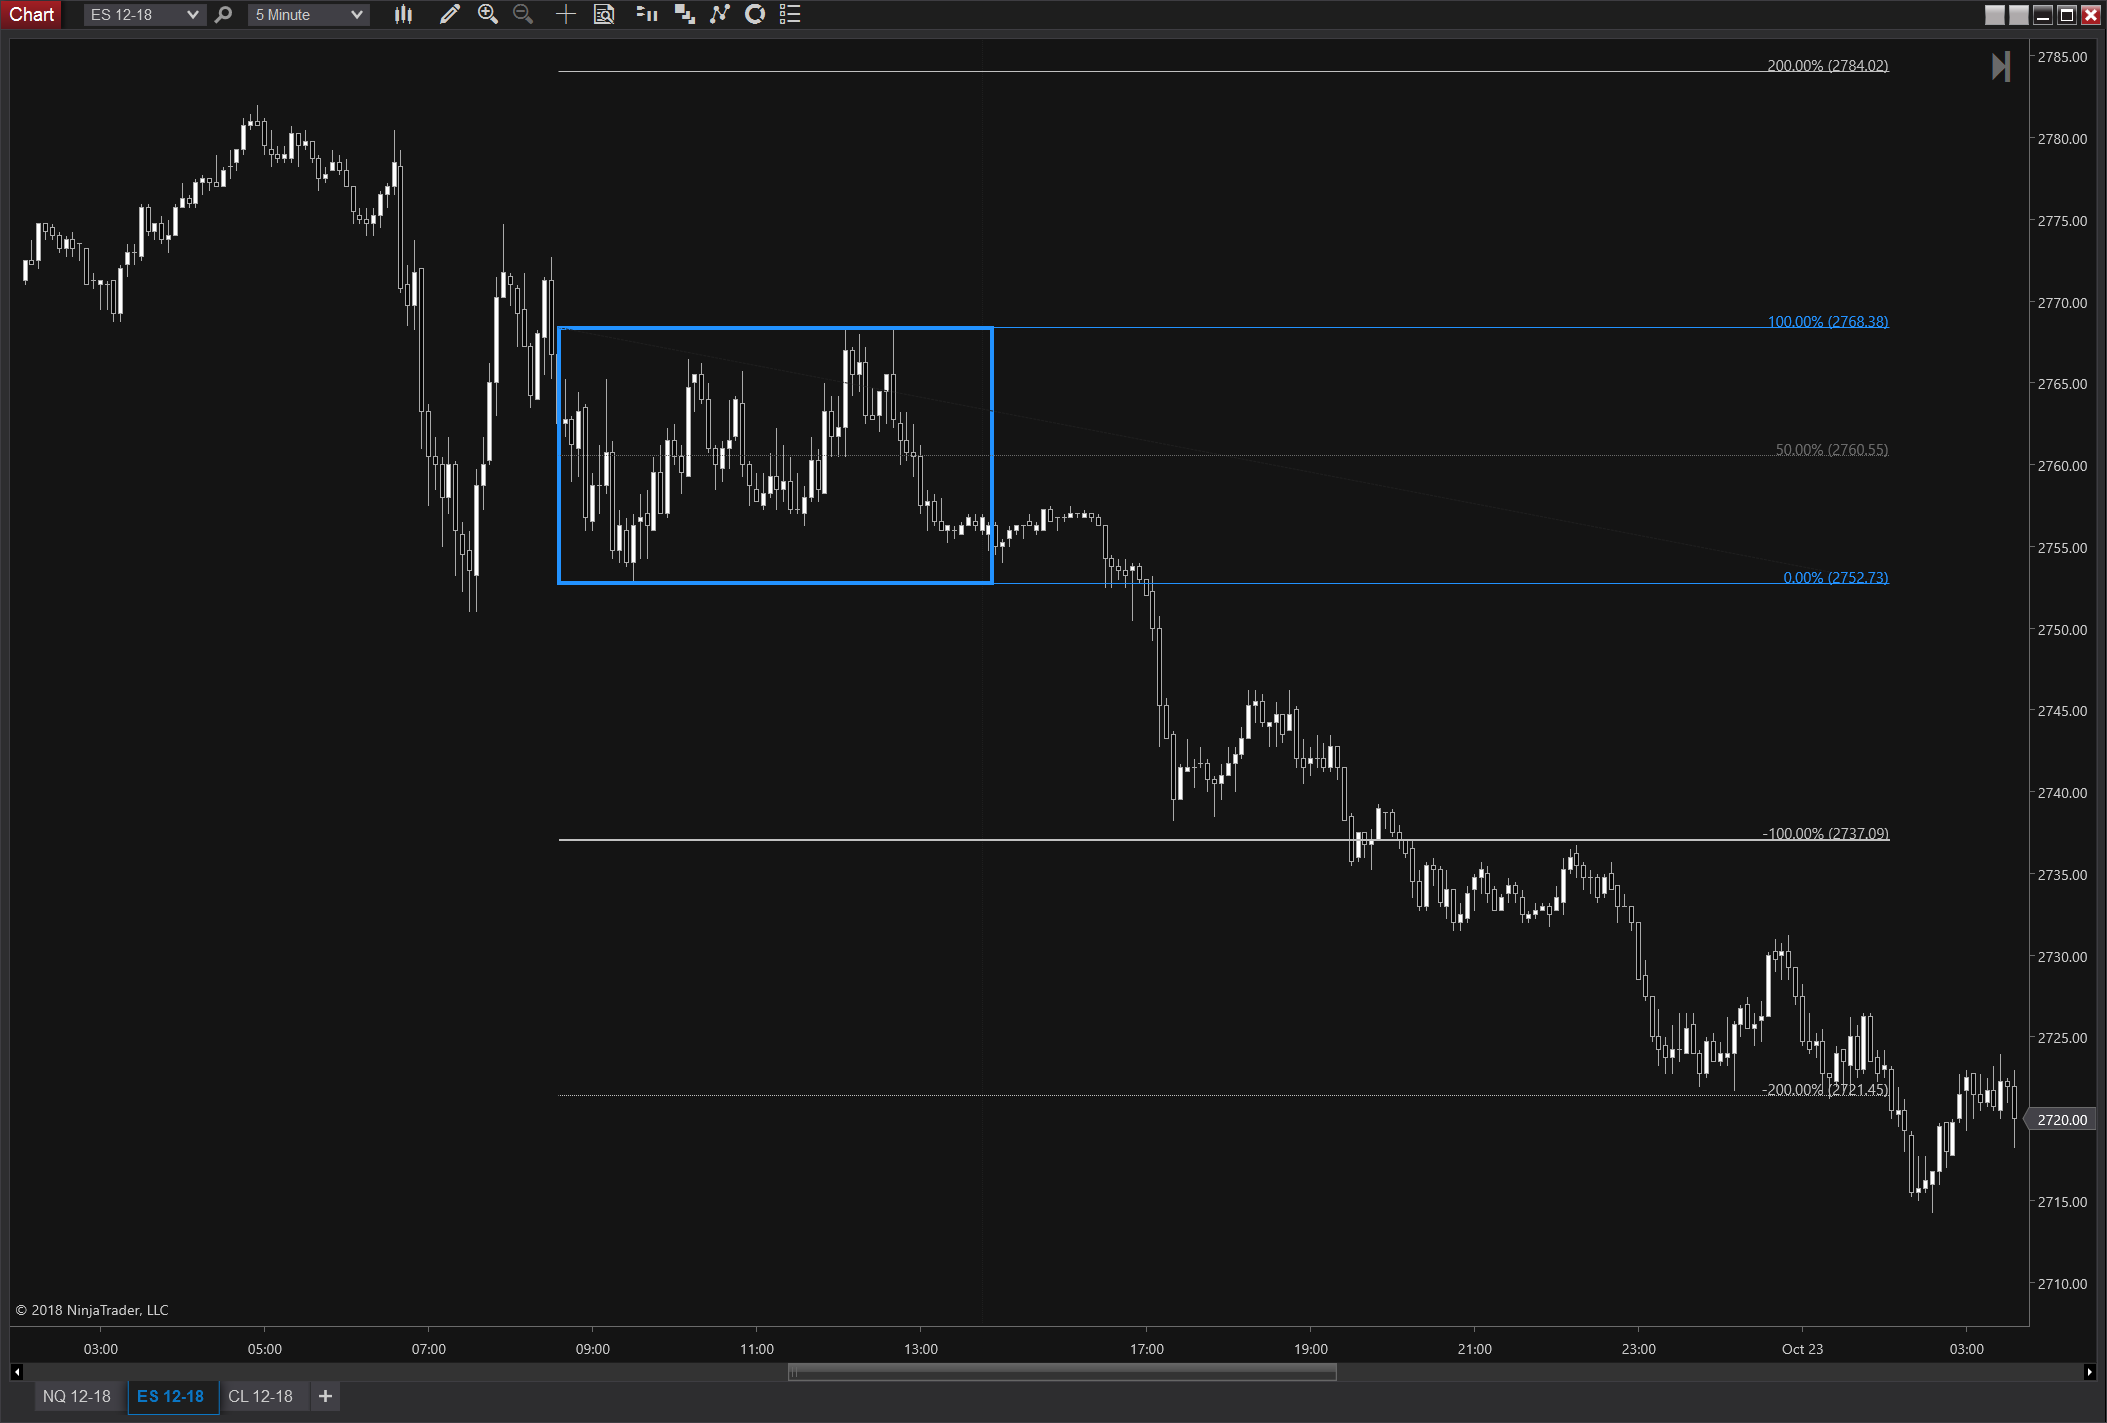
Some examples with just price and with a profile:
West Texas Intermediate Crude Oil
E-mini S&P 500
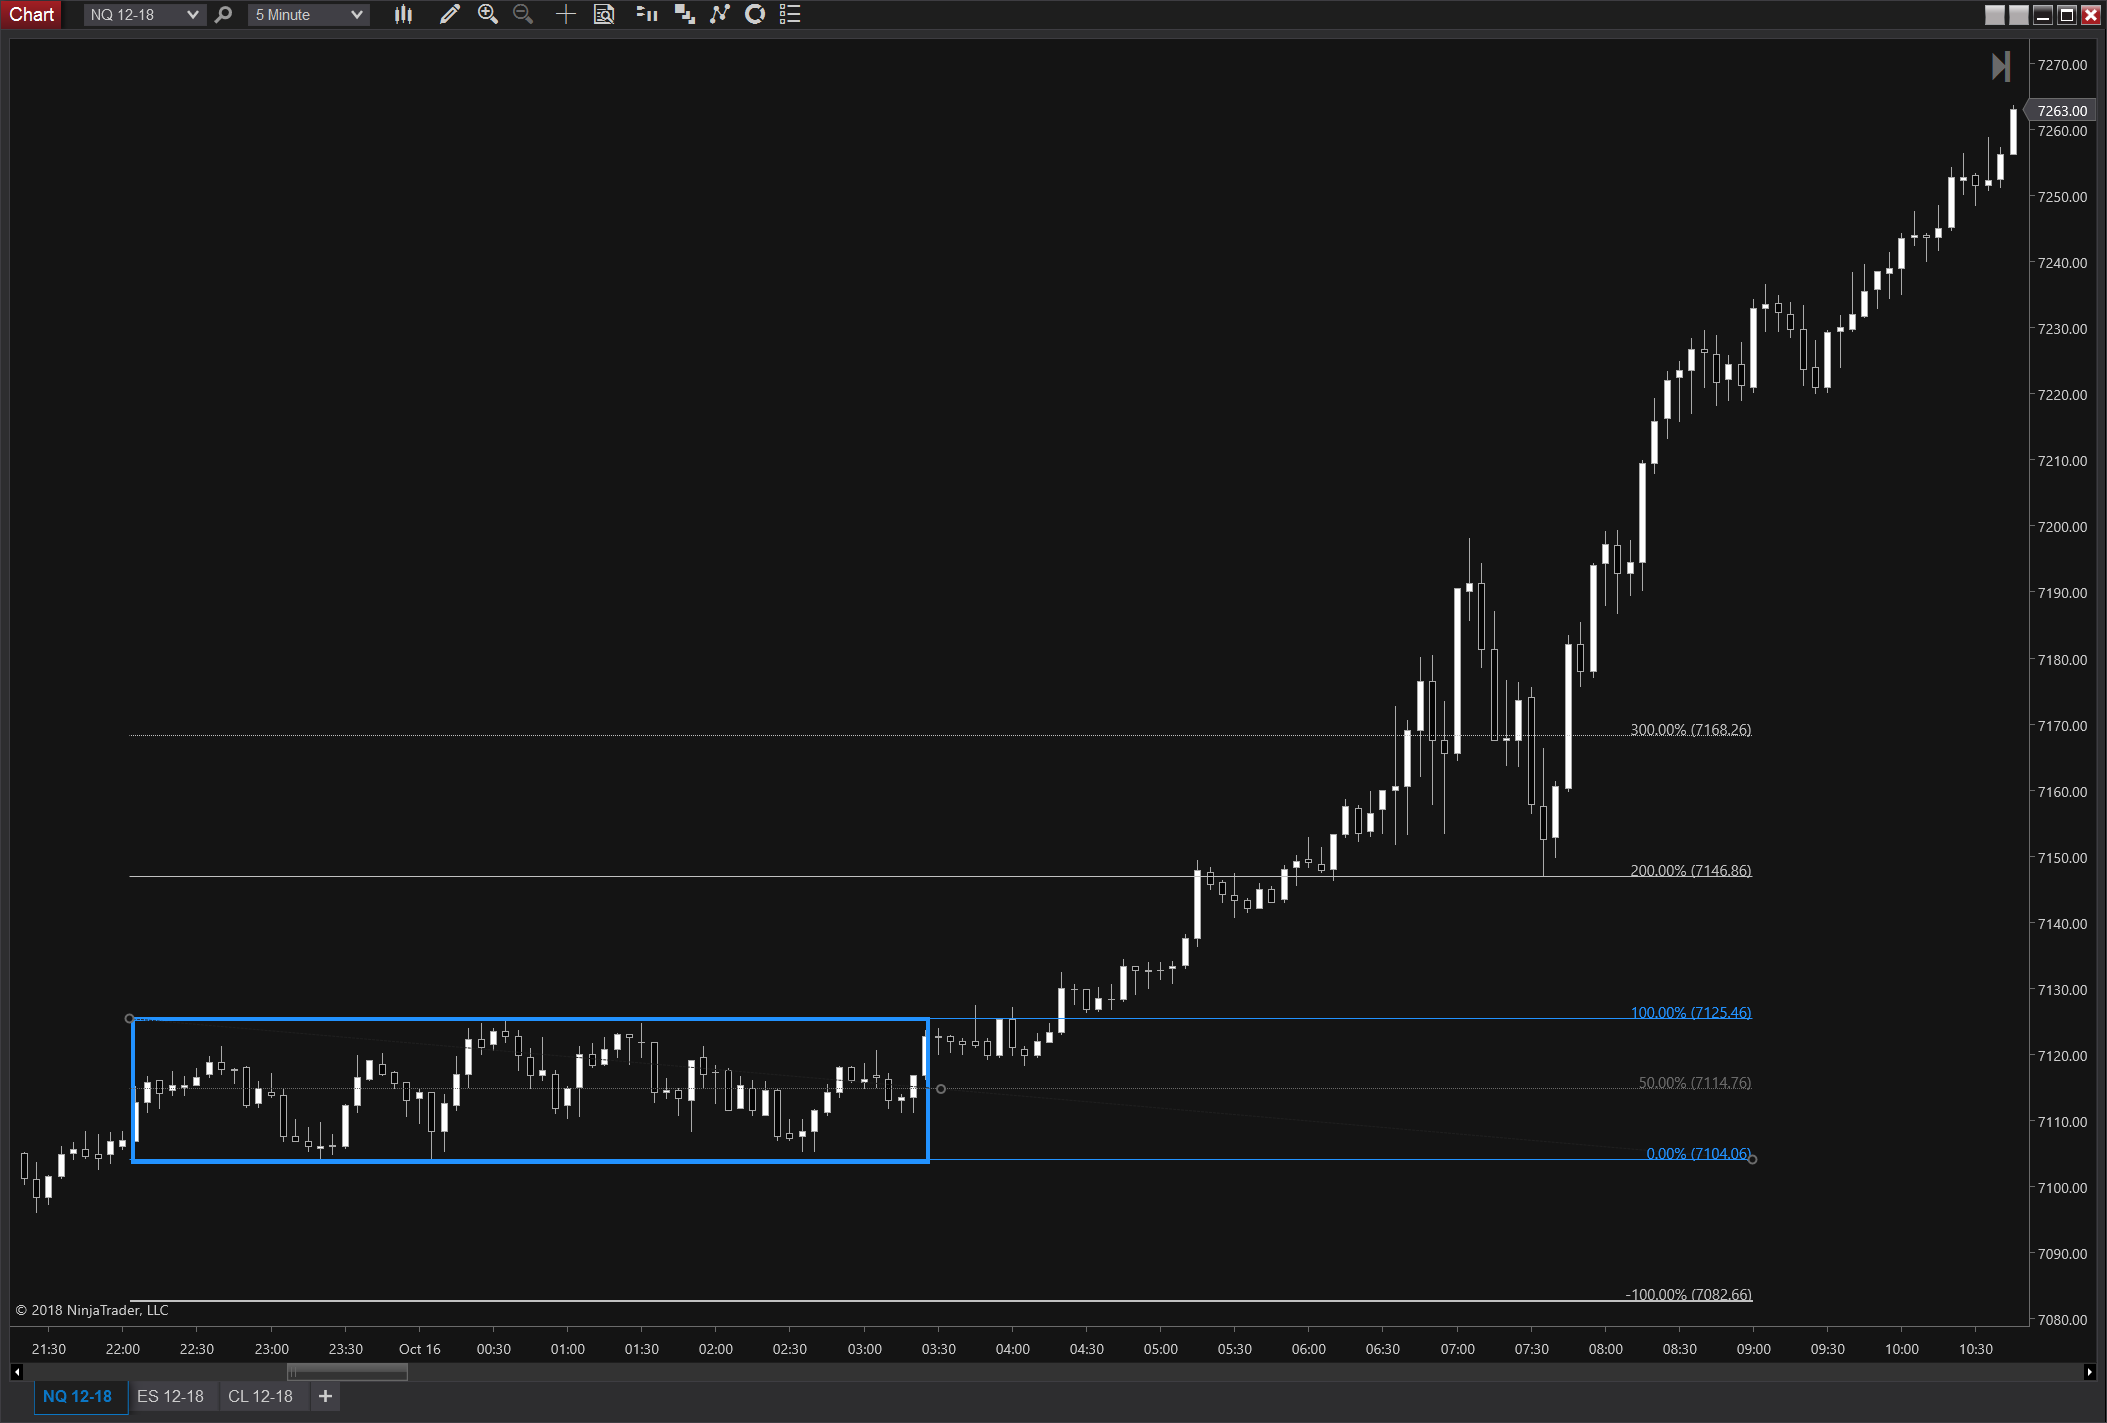
E-mini NASDAQ 100
Hopefully you see some commonality in these examples. Price is visibly stuck in a range, and touched the range boundaries a couple times. With the profiles, notice the VPOC (and very often VWAP) is in the center of the profile with a nice symmetric look on each side. The profile looks astonishingly like a normal distribution flipped on its side:
This is a “mature” balance that’s pretty likely to break in the near future. As you can see in each of these examples, it does. Why? Well, the market has only one job that’s actually a 2-phase cycle:
- Bring existing buyers and sellers together at prices where they are willing to transact based on available information, i.e. achieve balance
- When new information is available or new participants enter the market, facilitate the pricing in of that new information or new level of supply or demand
That’s it.
“OK, that’s great and all, but how do you trade it?” you’re saying to yourself right about now. I’m glad you asked (yourself), because as I covered in the Powderkeg Trade write-up, I use 100% and 200% of the balance range as targets on a break of either side with risk at the center of the range. And it gets to that 200%, well, a lot, making for a sold risk-reward ratio. Sometimes price goes even further, especially in times of elevated volatility. The reason it often breaks fast is because of stops just outside the range (remember the point about buried buying/selling above?).
West Texas Intermediate Crude Oil
E-mini S&P 500
E-mini NASDAQ 100
Find some examples on your own charts and see if you can apply this strategy. In the next installment(s) I’ll cover other ways to visualize and trade balances inside out.
Until then, amigos, trade ’em well…

