NOTE: if you haven’t read through Part 1, you’ll probably want to start there.
Every now and then I see a comment or quip where it seems pretty clear that a trader might not really get it. By it, I mean liquidity… aka order flow. Not being judgmental here, the term itself is confusing. I mean there’re a couple very different aspects to order flow and that’s really the cause of the muddle.
Active vs Passive Order Flow
There’s “active” order flow and then there’s “passive” order flow. Active order flow’s the volume that’s actually traded. Traded volume can be called active because it requires a market order (a willingness to pay the spread) in order for a limit order on the other side to be matched and traded out of the order book. The source of the market order can be considered an aggressor. And then there’s passive order flow – passive because it’s basically an advertisement for business. It’s telling the world I have x number contracts or shares to buy or sell at a given price. These orders are telling the world come and get me… if you’re willing to pay the spread.
So this confusion’s understandable. I like to call the active variety of order flow traded volume or tick analysis and call the ebb and flow of orders in the market depth book what it is… order flow proper.
Key Questions
To that end, in Part 2 (click here for Part 1) I want to show a good example from today in NQ of a counter intuitive order flow concept: liquidity attracts price. You can use this concept to help you answer (at least) three fundamental, objective questions:
- Are buyers/sellers responding to available liquidity?
- What’s the potential for price continuing to move in the same direction?
- What’s the potential for price to stop or reverse?
An Example
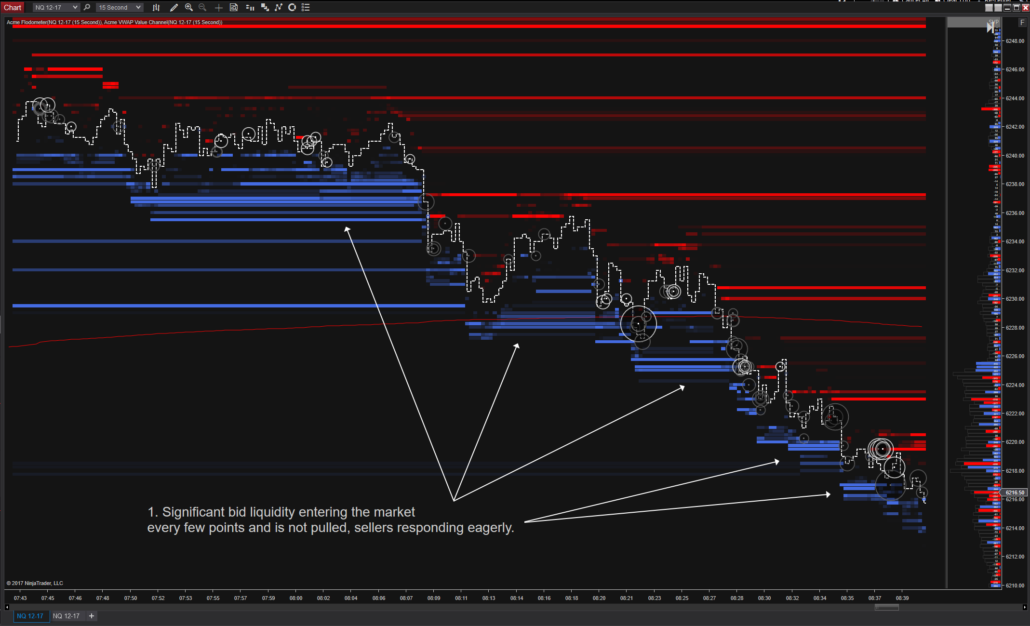
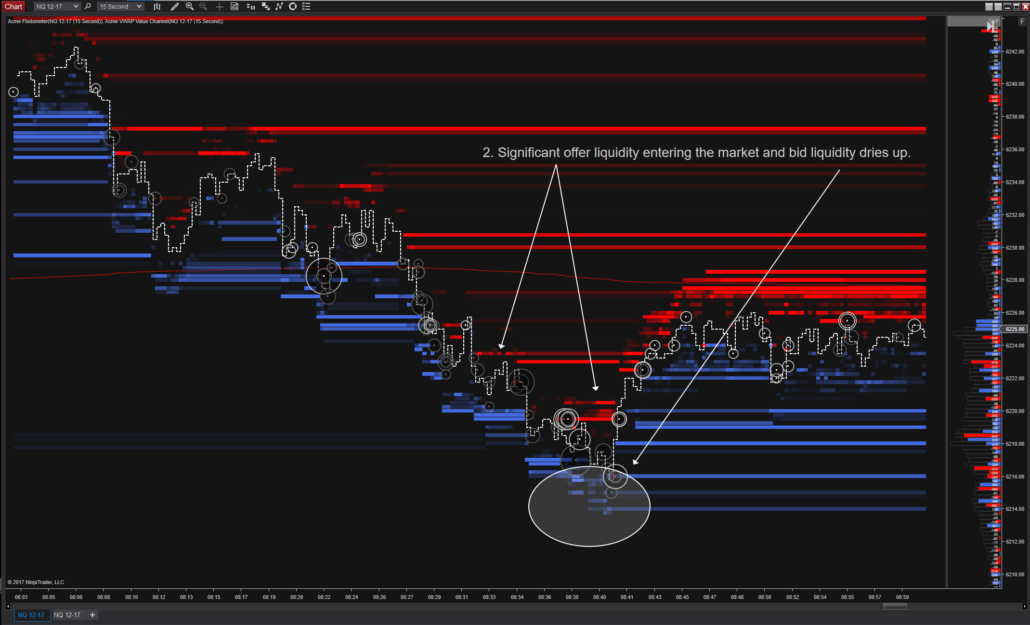
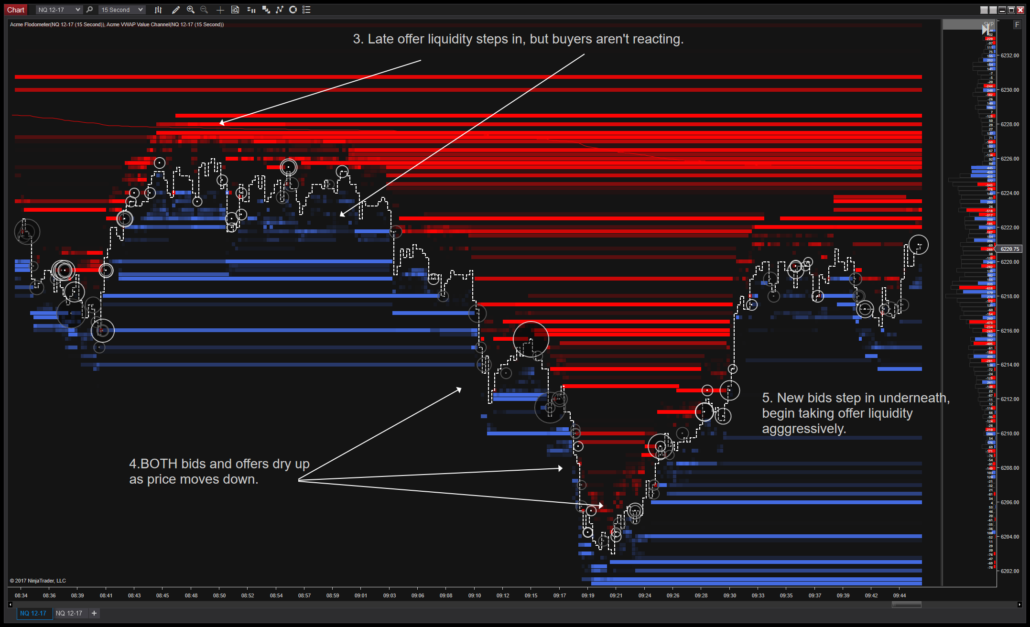
Below we have a chart series spanning 2 hours from about 7:45AM PDT to 9:45 AM PDT, and it pretty clearly shows how order flow can reveal to you what’s about to happen.
1. Just before 8:00 significant bid liquidity steps into the market and sellers begin responding. Bids are added, sellers continue to eagerly respond and drive down through the bids:
2. As price moves down, bid liquidity notably dries up around 6215. Offers also dry up very briefly at the same time. This can be an important clue for a cessation of hostilities, or a turn in a swing with power. Astute readers will notice what develops as price bounces from 16ish…
3. This move has passed 25 handles in just a few minutes. Some late sellers decide they want in (or out, we don’t really care which), but buyers aren’t reacting. Sellers now start to move at market and press price down another 20 handles in 15 minutes.
4. Notice the difference between the first leg of the move (above) and this one? Yeah, the bids are LESS and the offers are MORE. This liquidity imbalance is a clue that something is likely to happen. You guessed it. It’s about to attract price, but the other way round.
5. After a brief liquidity drought (get it?) new bids step in near 6200 and then begin using market orders to lift the offers for a fast 15 handle rotation the other way.
That’s it for this installment – hopefully it’ll be less than a year until my next installment. In the meantime… trade ’em well.


