UPDATE: after you’re done here don’t miss out on Part 2!
I’ve had muchas preguntas (many questions) on Twitter lately when I mention things like new offers/bids coming in to support/resist at [whatever price]. It’s really hard to explain in one chart image and 140 characters, and today we had some crystal-clear examples in the ZB futures contract, so lets explore.
Market Depth 101
Before we get to the heart of this, a little exposition is needed. Many traders don’t realize the futures (and most stock) exchanges actually have 2 feeds of data – the most well known feed is called level 1 and contains 3 (or 4) pieces of information for each trade, for each instrument:
- Price at which the trade occurred
- Volume: number of contracts or shares traded
- Time: the time at which the trade was executed
- Best bid and ask: the bid and ask prices which where in effect when the trade was executed (optional, not all instruments have this).
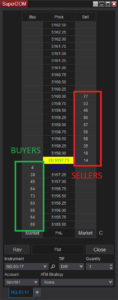
The other feed is market depth or level 2 data. That’s all the prices and volume above the best ask price (offers/sellers) or below the best bid (bids/buyers), and this is the information that’s used to populate a DOM (depth of market) display:
The total set of data – all the bids and offers at a given time – is commonly called the order book. If the price bars on your chart were a cake, this information is the raw ingredients for that cake. The process of matching buyers and sellers at the best bid and ask prices is the baking. Without both the ingredients and the heat, you ain’t getting a cake.
Right now you might be saying to yourself, “Yeah, ok, but why should I care? I don’t really like cake.”
I don’t either. But I do care about making trades at the right prices, so looking at all available data to make those buying and selling decisions (assuming you have that data) is just common sense. So what we’re going to do next is look at how we can combine traded volume at price with the order book to get the clearest possible picture of what’s happening in a market at a given time.
Important Evidence in Volume & Order Flow Analysis
Support and resistance efforts can be seen in both the traded volume history (see: Volume Impression) as well as the order book history (see: Flodometer). Some general patterns we want to look for in quality support/resistance are:
- Slow price movement/pace of trade
- Low/no demand/supply (willingness to buy/sell) at the top/bottom prices of a range
- Absorbtion: as price moves up, sellers are willing to fill every (or nearly every) market buy that appears. Vice-versa as price moves down.
- Increasing liquidity: for resistance that is volume in the order book increases on the opposite side of the move. If price is moving up, we want to see the total number of offers increase. Vice versa for support.
- Liquidity at multiple prices: significant market participants aren’t really all that concerned with a tick or two, they’re more concerned with cost bases or average prices. They’ll spread offers or bids out over several nearby prices to actually get filled as price moves in their desired zone.
Example 1 – Resistance that Works
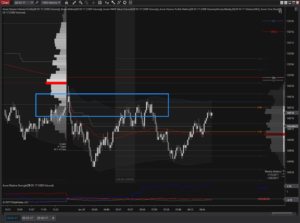
Around 6:45 PST we had a test of the previous days’ value area low as well as the 60-minute initial balance high. These are common prices at which resistance is found, but when price gets there are there any clues it’s going to hold?
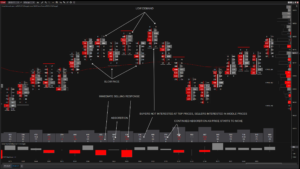
First, let’s look at traded volume. How’d we do according to the guidelines above?
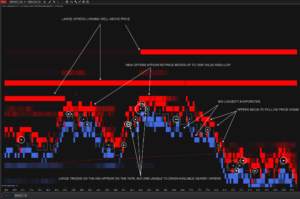
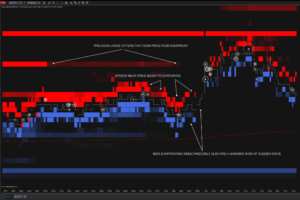
Next, let’s look at the same resistance from the perspective of the liquidity, or the order book:
There are other counter-intuitive ways to look at this information, these are commonly talked about as head fakes, traps or stop runs, but that’s for the advanced lessons. This’s a crash course, remember.
Example 2 – Support that Works
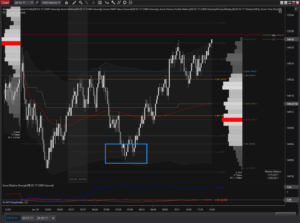
Same session, this time near 7:40 PST we saw ZB make another attempt at a low and buyers were successful and holding price above the Globex low of 148’30.
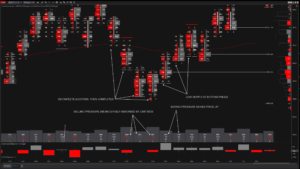
Using the criteria above, what were the signs in traded volume that the low would be held?
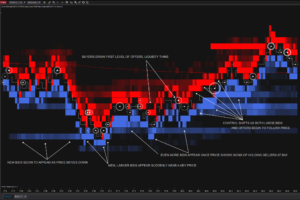
Now the same support attempt, from the liquidity perspective:
Example 3 – Resistance that Fails
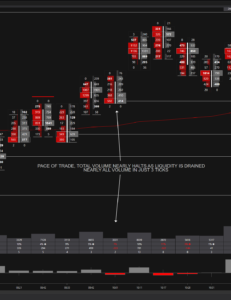
In this scenario, sudden moves can be really difficult to detect in traded volume, mostly because it looks like nothing at all is happening:
Though this is where watching liquidity conditions has an advantage. Price tends to move quickly in low-liquidity situations, but slowly when liquidity is high. Why? Because in order for price to move, the limit orders at each price in the book must be filled. Fewer orders, the easier it is to clean out a price and move to the next. So, when liquidity is being drained – rather than added – that’s very often a clue something’s going to happen very soon. With that in mind:
Wrapping Up
Like I mentioned at the start, this is a crash course. These are just a few examples in one instrument in one session. The evidence in traded volume and liquidity varies from instrument to instrument, but the signs are generally the same. Hopefully this was helpful and, until next time, trade ’em well…

